

Key Points
- Bitcoin price climbed higher recently and traded above the $3,800 resistance level against the US Dollar.
- This week’s crucial bearish trend line was breached with resistance at $3,830 on the hourly chart of the BTC/USD pair (data feed from Kraken).
- The price ran into a major resistance area at $4,080, but there are chances of more gains.
Bitcoin price gained traction and moved above $3,800 and $4,000 against the US Dollar. BTC/USD must break the $4,080 resistance level to trade further higher.
Bitcoin Price Analysis
Recently, there was a steady drop in bitcoin price from the $4,080 resistance against the US Dollar. The BTC/USD pair declined and traded below the $3,800 and $3,700 levels. However, buyers were able to protect losses below the $3,580 support area. A base was formed near $3,600 and later the price started a decent upward move. It climbed higher and broke the $3,700 and $3,800 resistance levels.
There was also a close above the $3,800 resistance and the 100 hourly simple moving average. The price also cleared the 76.4% Fib retracement level of the last slide from the $4,125 high to $3,520 low. More importantly, this week’s crucial bearish trend line was breached with resistance at $3,830 on the hourly chart of the BTC/USD pair. It opened the doors for more gains and the price moved above the $4,000 resistance. However, the $4,080 hurdle prevented further upsides and the price started consolidating gains. An initial support is near the $3,900 level and the 23.6% Fib retracement level of the last wave from $3,563 to $4,077.
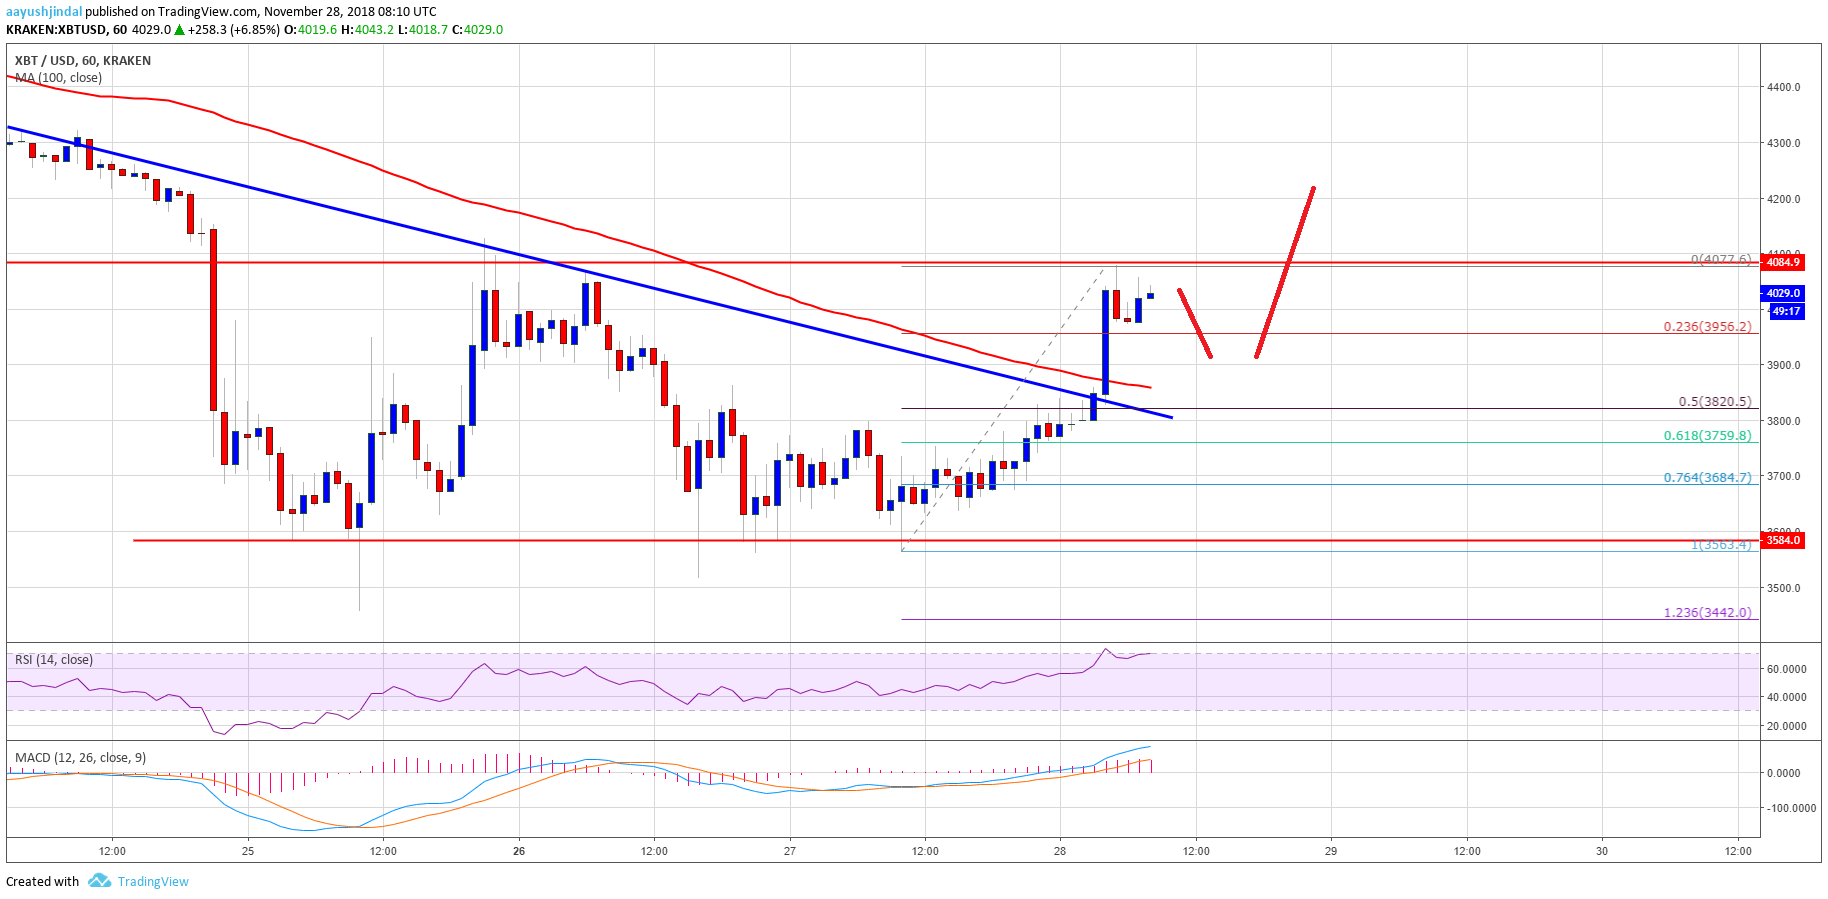

Looking at the chart, bitcoin price moved above the key barrier at $3,800-3,830. If there is a proper close above $4,080, there could be a solid bullish wave towards $4,200 and $4,250 in the near term.
Looking at the technical indicators:
Hourly MACD – The MACD for BTC/USD is back in the bullish zone.
Hourly RSI (Relative Strength Index) – The RSI is currently well above the 60 level.
Major Support Level – $3,900
Major Resistance Level – $4,080