

Key Points
- Bitcoin price climbed higher and broke the $4,080 and $4,200 resistance levels against the US Dollar.
- There is a short term bullish trend line formed with support at $4,050 on the hourly chart of the BTC/USD pair (data feed from Kraken).
- The price is currently trading nicely above the previous resistance (now support) at $4,080.
Bitcoin price made a few nice bullish moves above $4,000 against the US Dollar. BTC/USD must stay above the $4,050 and $4,000 supports to resume its upward move.
Bitcoin Price Analysis
Yesterday, we saw a decent rise in bitcoin price above the $3,800 and $4,000 resistances against the US Dollar. The BTC/USD pair tested the $4,080 and later corrected lower. Finally, there was a fresh upward move and the price broke the $4,080 resistance. The price climbed further higher and traded above the $4,200 and $4,260 levels. A new intraday high was formed at $4,400 and the price settled above the 100 hourly simple moving average.
Later, the price corrected lower and traded below the $4,200 level. There was a break below the 23.6% Fib retracement level of the last wave from the $3,563 low to $4,400 high. However, there are decent supports formed near the $4,080 and $4,050 levels. There is also a short term bullish trend line formed with support at $4,050 on the hourly chart of the BTC/USD pair. Below the trend line, the next support is at 50% Fib retracement level of the last wave from the $3,563 low to $4,400 high.
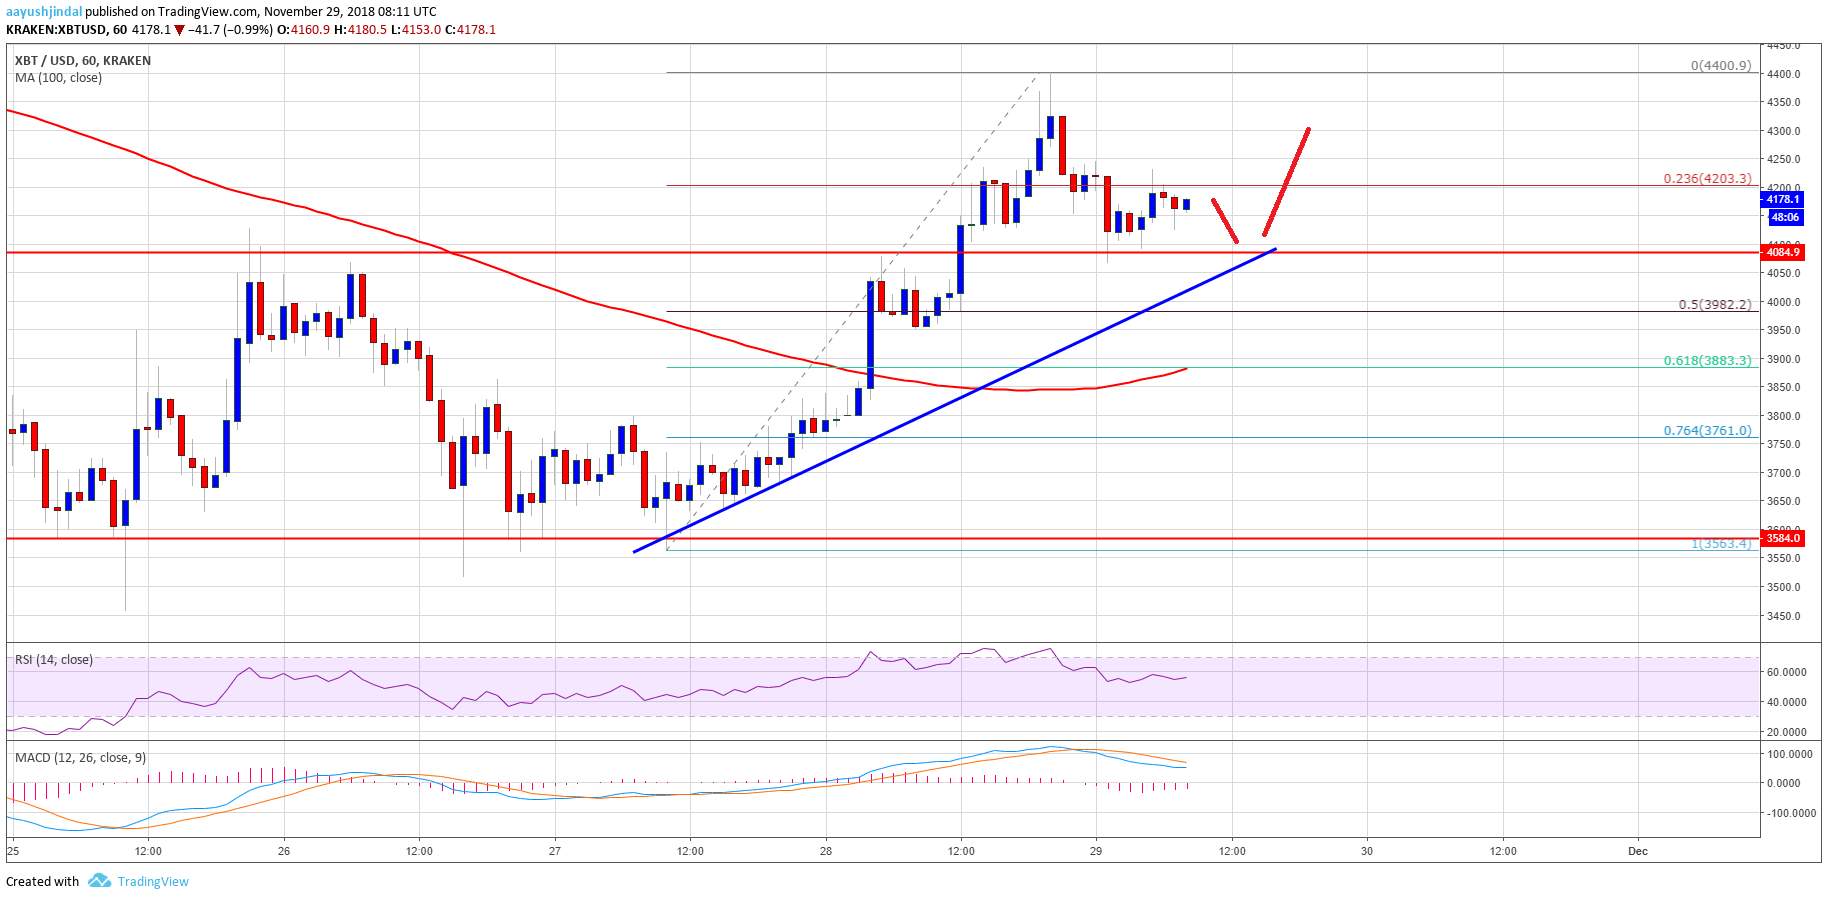

Looking at the chart, bitcoin price remains well supported above the $4,000 handle. As long as the price is above the 100 hourly SMA, there could be more gains above the $4,260 and $4,400 levels. On the downside, the main supports are at $4,080, $4,050 and $3,880.
Looking at the technical indicators:
Hourly MACD – The MACD for BTC/USD is slightly placed in the bearish zone.
Hourly RSI (Relative Strength Index) – The RSI is currently just above the 55 level.
Major Support Level – $4,050
Major Resistance Level – $4,400