So that’s it, another week complete in our bitcoin price trading efforts. As we said this morning, it has been a pretty busy week. Action hasn’t really slowed down all week, be it to the upside or the downside, and of course, we have seen an aggregate appreciation in the value of bitcoin for some considerable long-term holding gains. Against a backdrop of this overarching appreciation, however, we have also been able to get in and out of the markets with our intraday strategy to take advantage of shorter-term movements, both to the upside and to the downside.
With the European session now drawing to a close, and as the US afternoon gets underway, it is time to take one final look at price in an attempt to draw a little bit more cash out of the markets on any volatility we see tonight.
So, with this noted, and as we head into the close of the week, here is a look at what we are focusing on in the bitcoin price right now. As ever, take a quick look at the chart below before we get started to get an idea of what is on. It’s a five-minute candlestick chart and it’s got our range overlaid in blue.
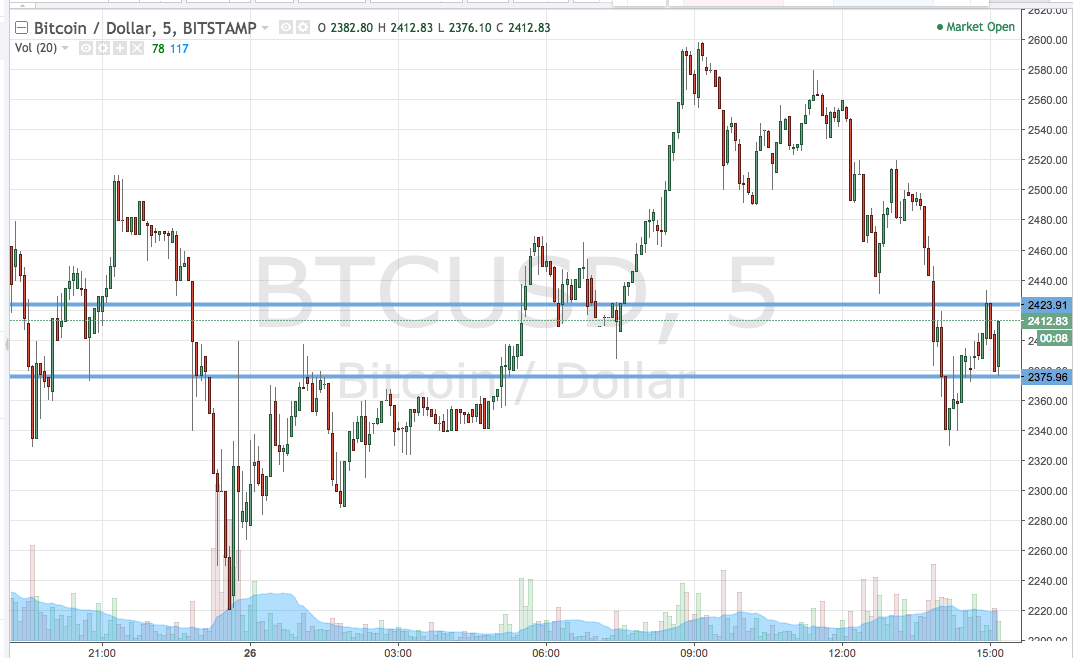

As the chart shows, the range we have in our sights this evening is defined by support to the downside at 2375 and resistance to the upside at 2423. We will initially look for a close above resistance to get us into a long trade towards an immediate upside target of 2450. Conversely, and looking the other way, if we see price close below support, we will enter toward a target to the downside of 2350. A stop loss on both trades will ensure that we are taken out of the positions in the event of a bias reversal.
Chart courtesy of Trading View