In this morning’s bitcoin price watch article, we discussed the potential for some volatility throughout today’s session. Bitcoin had a pretty up and down week last week, and while the action was conducive to our intraday strategy, it made for uncertainty as we headed in to a fresh session this week. Would the up and down action continue? Were we gearing up for some strength, or are we headed into a selloff? Well, the week is now officially underway, and it looks as though we are in for another week of big action.
So, with this said, how did our intraday strategy fare this morning, and where are we looking to get in and out of the markets this evening in Europe, and beyond that, as we shift into the Asian session tonight? Let’s have a look. As always, the chart below is a 15-minute candlestick chart that highlights the action seen across the past 24-48 hours. Take a quick look to get an idea of what’s on before we head in to the detail.
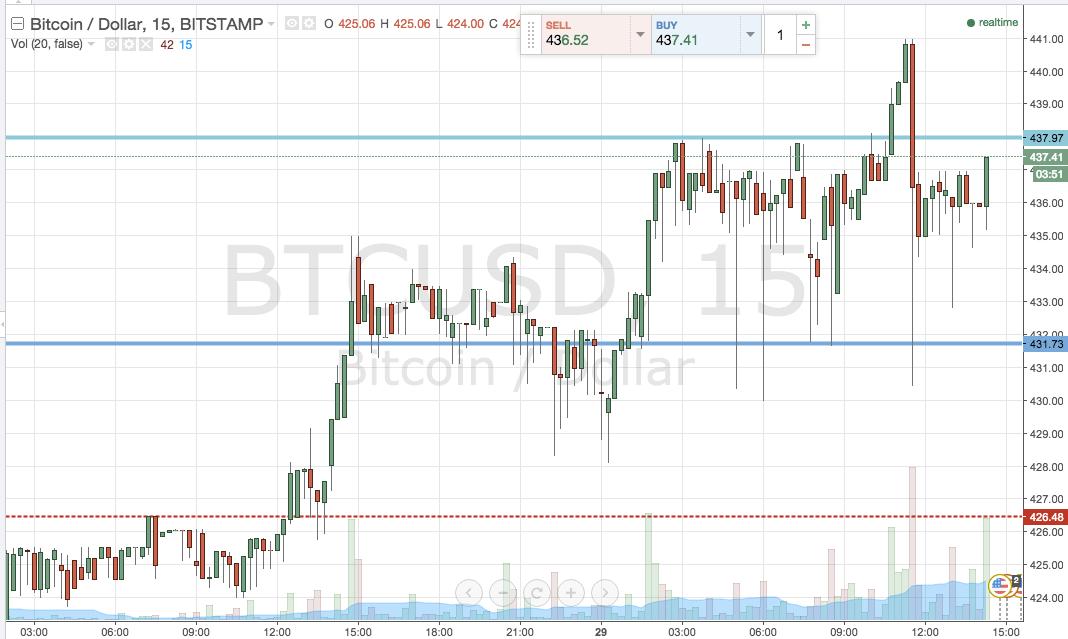

As the chart shows, shortly after we published this morning’s analysis, we got an upside break of resistance, and the close above that break put us long towards 442. Things looked like they were going our way, but having reached 441, and coming within touching distance of our target, price reversed and declined to trade back within range. As such, first trade of the week is a stop hit.
Not to worry, however. We’ll just realign our key levels and reenter on a secondary break.
So, since we remain within range, the levels we outlined this morning remain valid this evening. Support at 431.73, resistance at 438.
Long trade on a close above resistance towards 442 flat, stop at 436. Short trade on a close below support, targeting 426.5 with a stop just above support defining the downside risk on the position.
Charts courtesy of Trading View