Ok then, it’s time for us to take a second look at action in the bitcoin price for the day, and to try and figure out how we are going to approach the markets this evening as per the rules of our intraday strategy. Things have – once again – been pretty volatile across the session, and we’ve had plenty to go at from an intraday perspective, with our breakout strategy giving us plenty of opportunities to get in and out of the markets.
We’re hoping for more of the same tonight, and with the volume we’ve been seeing as late this isn’t too much of a stretch, but we’re always prepared for a turnaround, and we’ve seen it happen before.
With this noted, then, here’s a look at where we are looking to get in and out of the markets according to the rules of our intraday strategy this evening, and an overview of how action today feeds into this evening’s approach. As ever, let’s start wit ha chart. The chart below is a five-minute candlestick chart and it’s got our key range overlaid in green. Take a look at that before we get started so as to get an idea of what’s on.
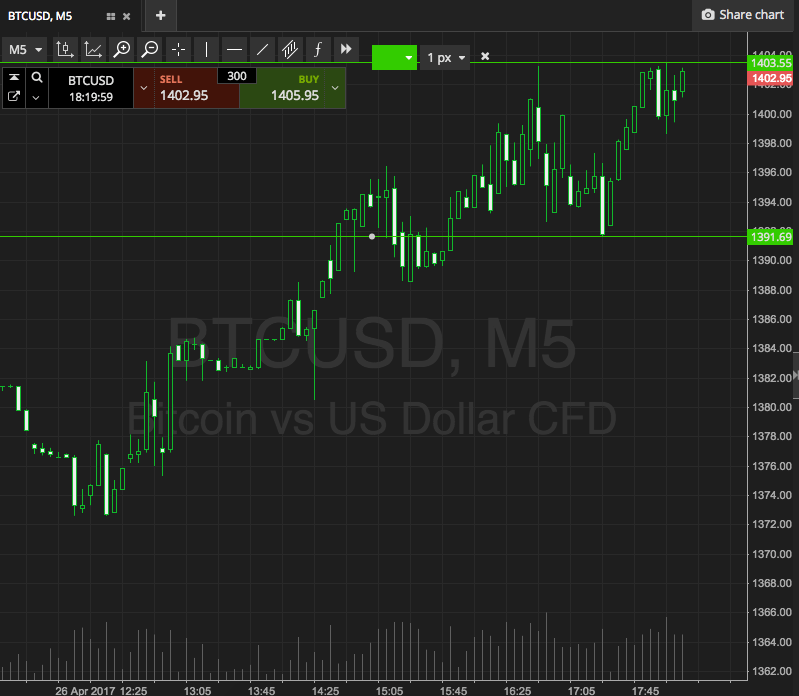

So, as the chart shows, the range we’ve got outlined this evening is defined by support to the downside at 1391 and resistance to the upside at 1403. We’re going to initially look for a close above the latter of these two levels, our resistance level, to validate an upside entry with an immediate target of 1415. A stop on the trade at 1400 will ensure we are taken out of the position in the event that price reverses against our bias.
Looking short, a close below support will get us into the downside toward 1380. Stop at 1394.
Charts courtesy of SimpleFX