And so here we go on another week of trading in the bitcoin price. We have been saying for a while now that the overarching momentum is to the upside and price is being controlled by the bulls in the market. Over the weekend, we got further validation of this suggestion, with price running through the 2700 level and holding above it right up to the current time. The next major level is 2800 and there is a good chance that we will see this level hit and broken during the session today.
With this in mind, then, let’s outline some interim key levels with which we can seek to profit from any volatility in and around the major break levels as and when they are hit. As ever, take a quick look at the chart below before we get started so as to get an idea of where things stand right now. It is a one-minute candlestick chart it has our key range overlaid in blue and red.
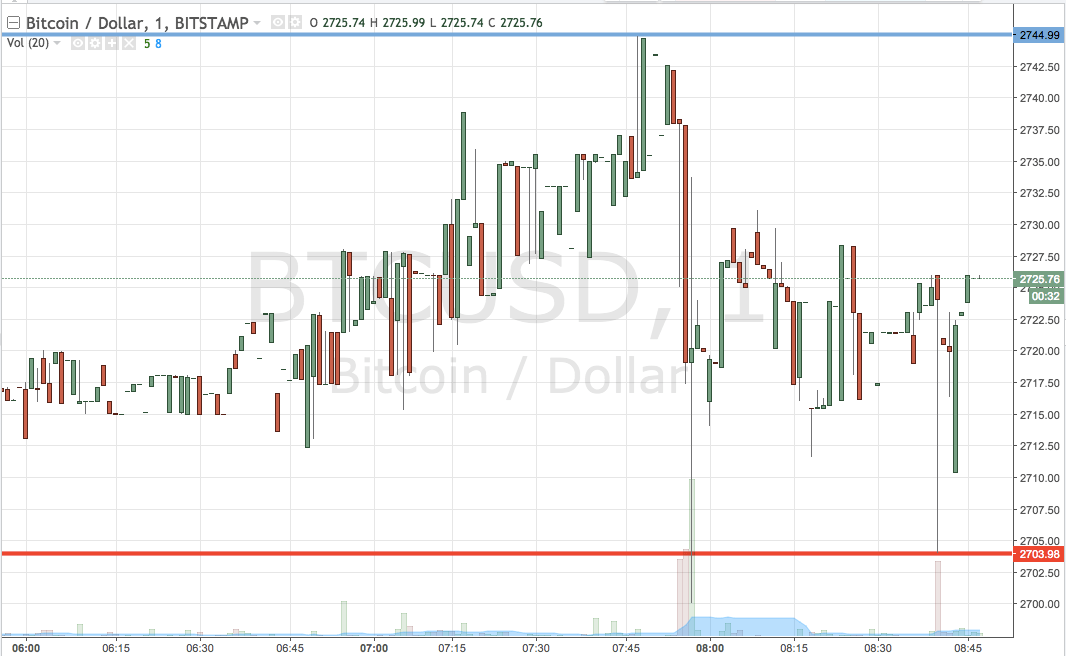

As the chart shows, the range we are working with during the session today comes in as defined by support to the downside at 2703 and resistance to the upside at 2744. Standard breakout rules apply for the session, so we will look for a close above resistance to validate an immediate upside target of 2765. A stop loss on the trade somewhere in the region of 2735 will ensure we are taken out of the position in the event of a bias reversal.
Looking the other way, a close below support will have us in short towards 2675. Again we need a stop loss on this one and somewhere in the region of 2710 looks like it should do the job. Let’s see how things play out during the session today and we will revisit and reevaluate in response to any action later on this evening.
Chart courtesy of Trading View