We are just about getting started with a new week in our bitcoin price trading efforts and there is plenty to go at based on over the weekend action. The bitcoin price broke the $2000 mark across the period and ran to highs at close to a couple of hundred dollars above this level. Since reaching these highs, we have seen something of a correction, but nothing too severe, and we remain above the above-noted break levels as things stand. The volatility allows us to set up against price with a relatively wide range, so we should have a pretty good chance of drawing a profit from the market during today’s early European session.
So, with this in mind, and as we head into the morning session, here is a look at what we are focusing on and where we are looking to get in and out of the markets according to the rules of our intraday strategy. As ever, take a quick look at the chart below to get an idea of our range before we get started.
It is a five-minute candlestick chart, and it has our key range overlaid in green.
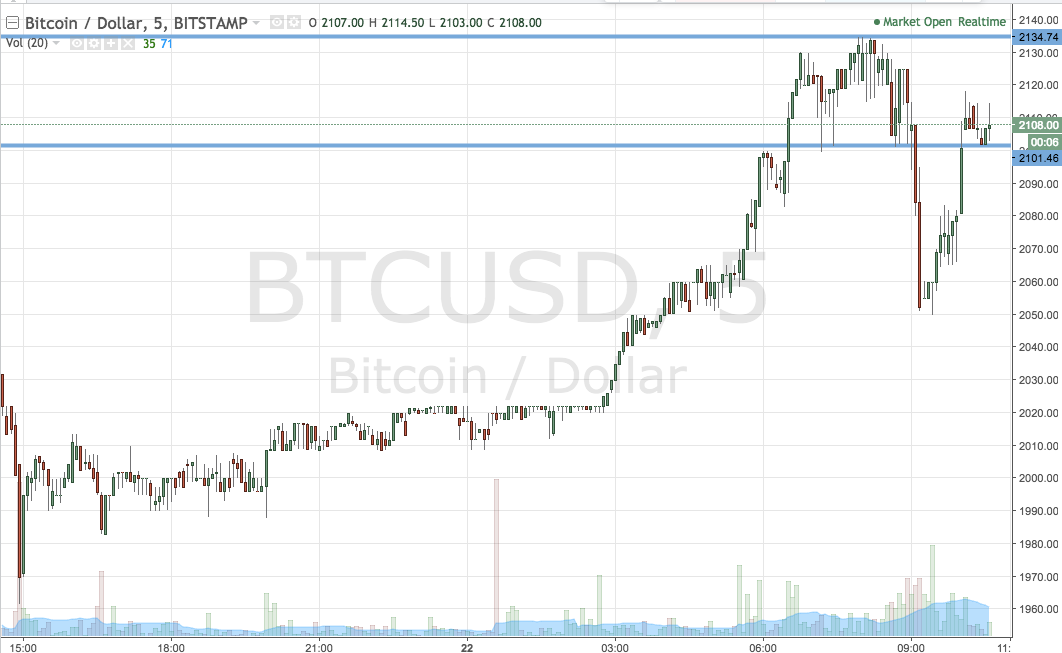

As the chart shows, the range we are looking at for the session today is defined by support to the downside at 2108 and resistance to the upside out 2134. We are going to go at price with just our breakout strategy for the time being, and we will consider bringing intrarange into play a little later on if we see an initial break on the just defined range.
With that noted, then, if we see a break above resistance, we will look to get in long on a close above this level towards an immediate upside target of 2150. Conversely, and looking to the downside, a close below support will have us in short towards 2090.
Let’s see how things play out.
Charts courtesy of Trading View