Things are on the up. Slowly, but surely, the bitcoin price is rising, and we are heading towards the 1200 mark. Things have been a little slow over the last few days, and while we’ve had the opportunity to get into the market on a couple of occasions, and we’ve taken a few decent profits from the trades we’ve gotten into, there hasn’t been any real momentum behind the entries. Once 1200 breaks, I reckon this will change. It’s a psychologically significant level, and one that should trigger a flurry of entries from all ends of the market when it comes around.
We’re not there yet, of course. Slowly but surely.
So, where do things stand today, and where are we looking to get in and out of the markets as the bitcoin price moves?
Let’s take a look.
As ever, get a quick look at the chart below before we get going to get an idea of where things stand. It’s a five-minute candlestick chart and – as usual – it’s got our key range overlaid in green.
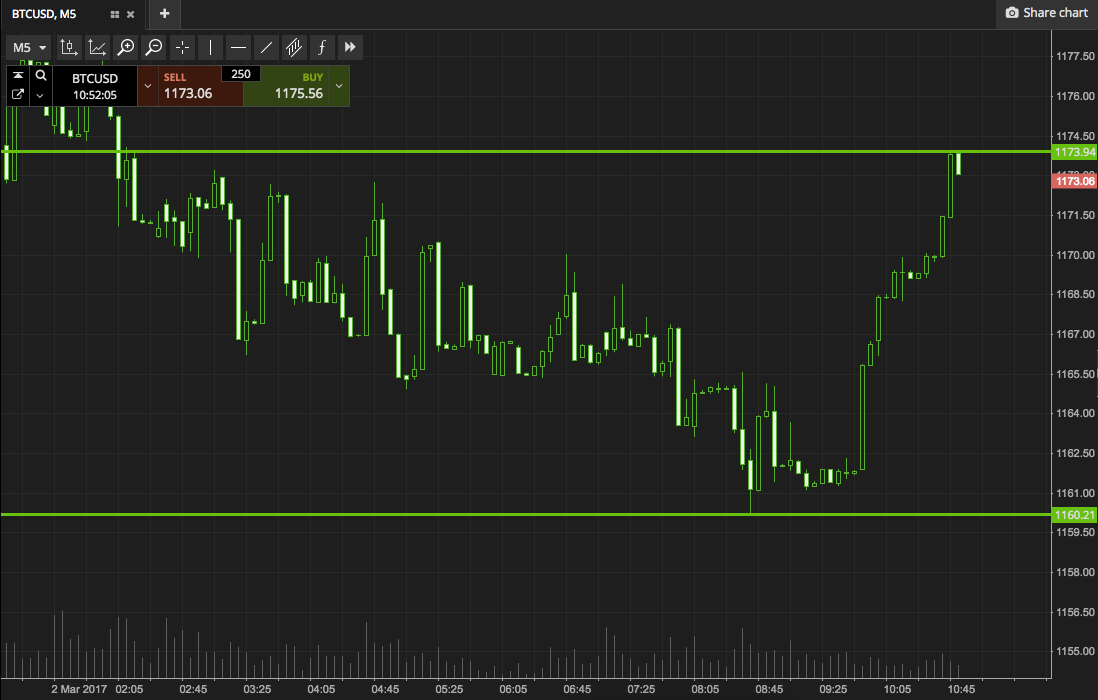

As the chart shows, the range we are going at today is defined by support to the downside at 1160, and resistance to the upside at 1173. We could theoretically go at price with an intrarange strategy on this range, but we’ll stick with breakout for now, just so as to keep focus on any momentum runs.
If readers want to bring intrarange into play, long at support and short at resistance. Target the opposing levels, as ever.
With our breakout strategy, we are going to look for a close above resistance to validate an upside entry towards 1185. Conversely, a close below support will get us in short towards 1148. Stop losses in and around two or three dollars the other side of the key levels will ensure we are taken out of the trade in the event of a bias reversal.
Charts courtesy of SimpleFX