In this morning’s bitcoin price analysis, we rushed into our daily take as price was moving fast (we were looking at an upside gap as the piece was being put together) and we didn’t want to waste any time looking at overnight action.
This evening, we’re going to mimic that approach.
Action today has been relatively flat anyway, and other than a bit of sideways trading carving out a pretty nice range for us to go at this evening, there’s practically nothing of note taken place.
So, with this noted, let’s get to the detail and get our strategy outlined for this evening.
Take a look at the chart below.
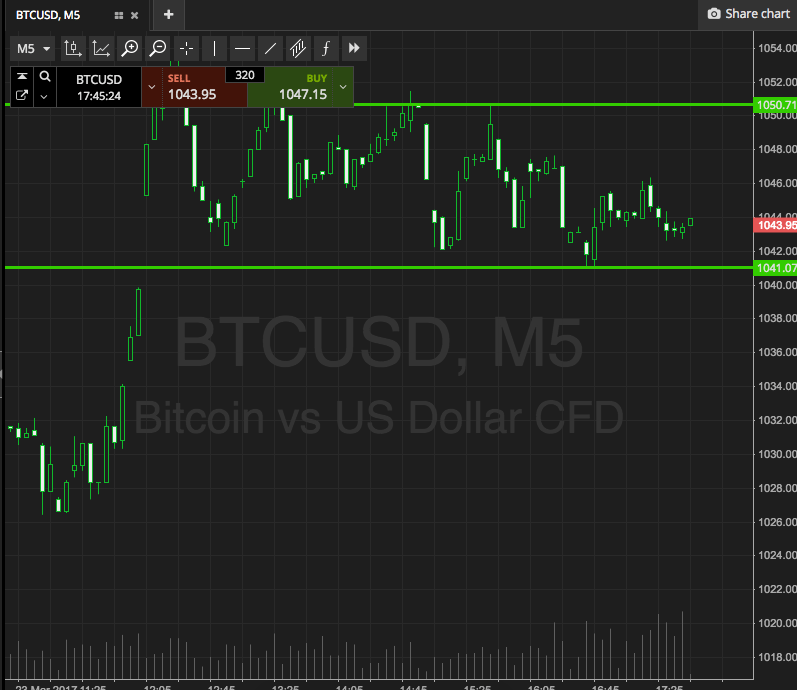

It’s a five-minute candlestick chart and it illustrates the action we alluded to above – a break, a gap, a peak and then, a period of drawn out consolidation. Sometimes consolidation like this can be frustrating, but it can also be great strategy fodder, as it gives us a neat range to play with once it ends (i.e. once we get a breakout). Additionally, when we do get the breakout, the momentum is generally sustained enough to bring about a pretty decent sized trade, because the consolidation serves as a sort of parallel balancing and winding up of markets.
So, as the chart shows, the range we are looking at right now, and the one that is defined by the above discussed consolidation period, comes in at 1041 to the downside (our support for the evening) and 1050 to the upside (resistance for tonight). Standard breakout rules apply to the charts, so if we see a close above resistance, we’re going to get in long towards an upside target of 1060. Conversely, a close below support will get us in short towards a downside target of 1030.
Let’s see what happens.
Charts courtesy of SimpleFX.