Another day down and another exciting run of action in the bitcoin price. Things continue to play to our favor in our trading efforts, with price moving considerably throughout the European sessions and then – beyond the close of these sessions – into the Asian sessions and the US afternoon throughout the evening. As we noted this morning, we’re not even having to try that hard. When price moves like this it’s all about being in the right place at the right time and – in this sort of market – it’s hard not to be in the right place.
This doesn’t mean we’re enjoying risk free trading; chop outs are the number one risk across pretty much the entire spectrum of market conditions and we’ve always got to take into consideration the potential for any such action. That’s what our stop losses are for, however. As long as we keep them tight, we don’t need to worry too much about where the things go.
Anyway, let’s stop rambling and get to the detail.
As ever, and before we get into the numbers, take a quick look at the chart below to get an idea of what’s on and where we hope to get in and out of the markets according to the rules of our intraday strategy. It’s a five-minute candlestick chart and it’s got our key range overlaid in green.
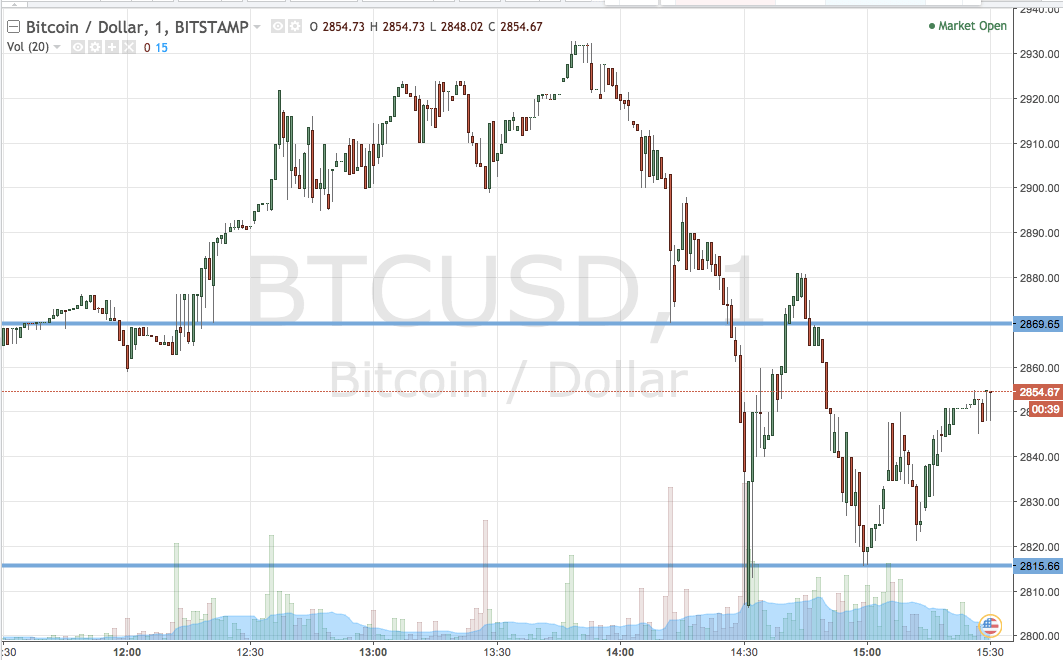

As the chart shows, the range we’ve got in our sights for this evening is defined by support to the downside at 2815 and resistance to the upside at 2869. Nothing fancy this evening, just low hanging fruit. So, long on a close above resistance towards an upside target of 2885. Short on a close below support towards a downside target of 2800 flat. Stops in place as described above will ensure we are taken out of the trades if price reverses.
Charts courtesy of Trading View