Sometimes in the financial markets, we get extended periods of consolidation and the only way to trade in these conditions is by tightening things up and looking for short, sharp scalp entries. Often, these consolidation periods come after sharp increases in volume. Action over the last 24 hours or so has proven to be exactly that – a drawn out period of sideways action that isn’t particularly tradable from a breakout perspective.
It doesn’t make too much of a difference to the way we approach the markets, but it does mean we have to ensure our risk management is sound. There is no quicker way to lose money than to get chopped around in consolidating markets and this is true whether we are looking at the bitcoin price or the equities markets.
So, with all that said, let’s put some levels in place that we can use going forward into today’s European session. As ever, take a quick look at the chart below before we get started so as to get an idea of what is on and how action overnight feeds into the session this morning. It is a one-minute candlestick chart and it our range overlaid in red.
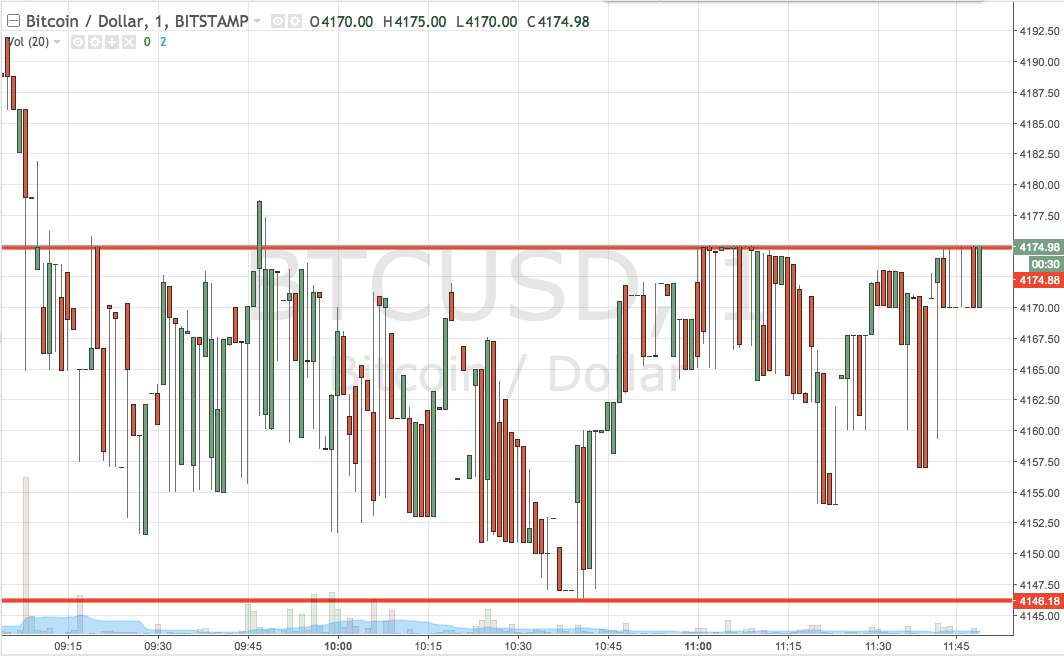

As the chart shows, the range we are looking at for the session today is defined by support to the downside at 4146 and resistance to the upside at 4174. Standard breakout rules apply for the session, so we will look for a close above resistance to validate an upside entry towards a target of 4200. A stop loss on this one at 4168 looks good. Looking the other way, a close below support will have us in short towards 4100 flat. A stop loss on this one at 4154 works to ensure that we are taken out the position in the event of a bias reversal in the bitcoin price.
Charts courtesy of Trading View