So we are midway through the week, and price hasn’t really done too much in terms of volatility thus far. We did see some up and down action early on Monday, and we’ve managed to get in and out of the markets on a couple of occasions on breakout entries over the last day or two, but there haven’t really been any sustained runs, and the bitcoin price remains sub-1200 for now. We are going to go out on a limb and make a prediction – that price will break back above the 1200 level before the week is out, and if it does, then we will see 1250 before the fresh week kicks off next Monday. It’s just a prediction, of course, and doesn’t really affect how we’re going to approach the markets in our intraday efforts, but it gives us something to work towards from a risk management perspective.
Anyway, let’s focus on the here and now, and try and get some levels outlined for the session going forward. Take a look at the chart below to get an idea of where things stand, and where we are looking to get in and out of the markets according to our intraday strategy today. It’s a five-minute candlestick chart and it displays the overnight action in the bitcoin price (or thereabouts).
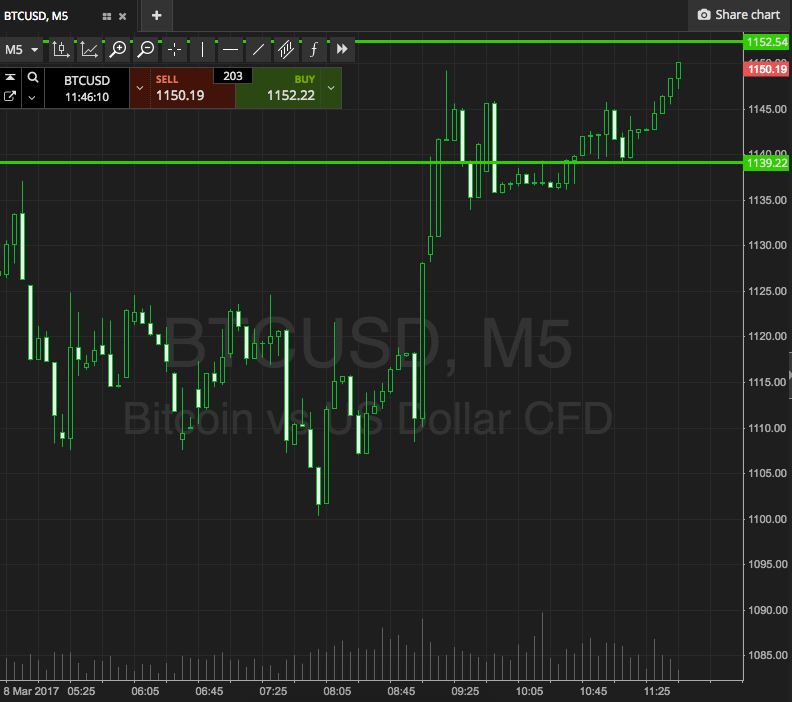

As the chart shows, the range we are looking at this morning is defined by support to the downside at 1139 and resistance to the upside at 1152. Standard breakout rules apply to this range, so if we see a close above resistance, we’ll be looking to get in long towards an immediate upside target of 1165. A close below support, on the other hand, will put us in short towards a downside target of 1130. Stops, as ever, remain in place to ensure we get out of the trade if and when price reverses.
Charts courtesy of SimpleFX