So it is time to get things moving on another fresh week of trading in the Bitcoin price and it looks as though we are in for a pretty strong one from a volatility perspective; that is if action over the weekend is anything to go by. Price jumped all over the place throughout the Saturday and Sunday sessions on slightly dampened volatility, suggesting we should see some degree of breakout activity early week as markets rebalance in response to the last couple of days’ worth of action.
When price action is as volatile as it was over the weekend, it gives us an opportunity to set up against the market with some pretty solid levels. Recent highs and lows serve as stronger corrective boundaries, so with a couple of these in place today we should have no problem jumping into, and drawing a profit from, the markets.
With this in mind, and as we move forward into the start of the European session today, here is a look at what we are focusing on in the bitcoin price and where we intend to get in and out of the market according to the rules of our intraday strategy.
As ever, take a quick look at the chart before we get started. It is a one-minute candlestick chart and it has our key range overlaid in green.
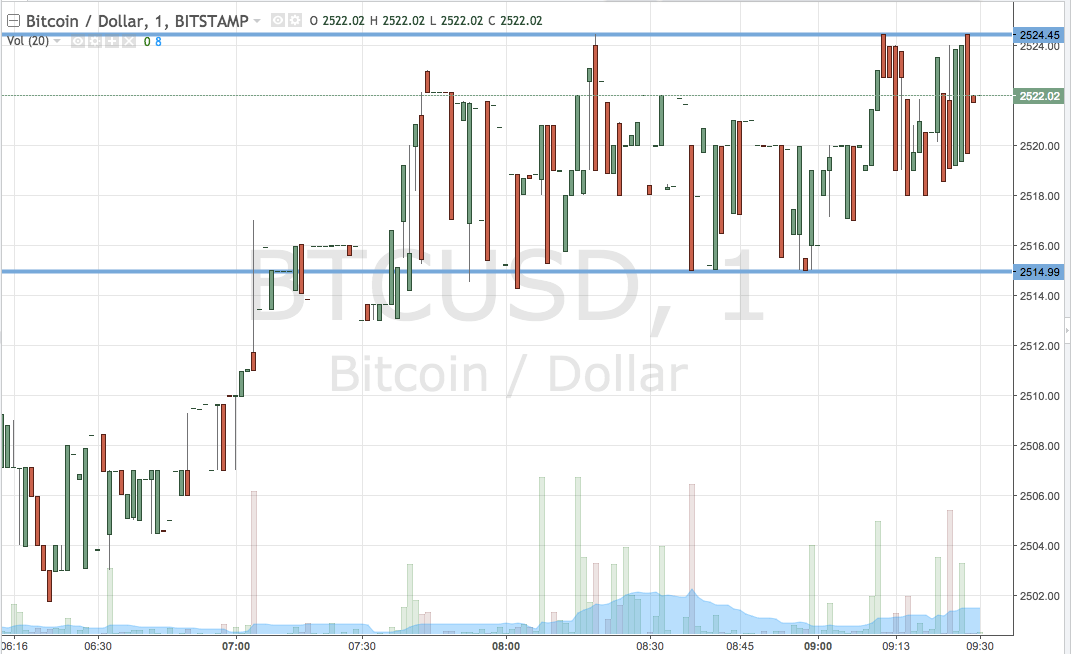

As the chart shows, the range we are focusing on for the session today is defined by support to the downside at 2514 and resistance to the upside at 2524. If we see price break above resistance, we will enter long towards an upside target of 2540. A stop loss on the trade at 2520 works to define risk.
Looking the other way, a close below support will have us in short towards a downside target of 2500 flat. A stop loss on this one at 2527 looks good.
Chart’s courtesy of Trading View