It’s the start of a fresh week, and the weekend just gone has been a bit of an anomaly when compared to the last couple of weeks’ worth of action. Often, we will see a large, distinct, and usually sustained, price move, and given the action we saw last week, we expected this to continue as a trend. Across the weekends just gone, however, price has remained relatively flat. What this means for the week going forward is unclear, but chances are we will see a bit of movement as volume returns to the market. So, and as we head into a fresh week of trading, here are the levels that we’re focusing on in the bitcoin price, and where will we look to get in and out the markets as price matures throughout the session. As ever, take a quick look at the chart below to get an idea of the range in question. It is a 5-minute candlestick chart representing the last 24 hours’ worth of action in the bitcoin price.
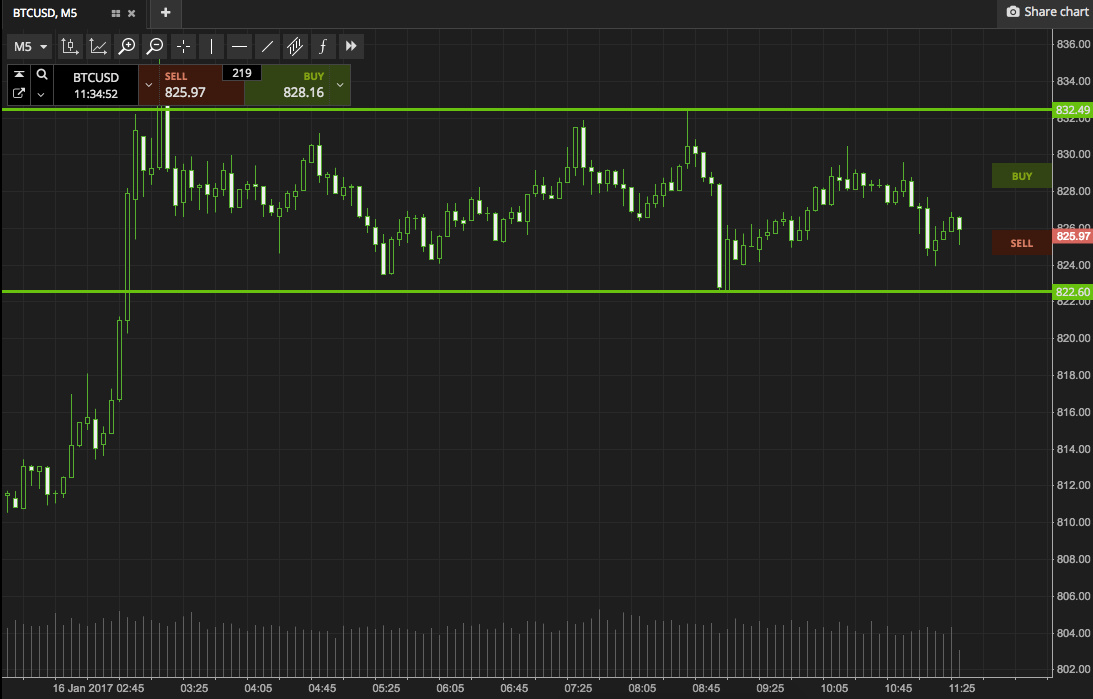

As the chart shows, the range we are looking at for today is defined by support to the downside at 822 and, to the upside, resistance comes in at 832. It’s probably a little too tight to attempt an intrarange strategy, but for those looking for an aggressive entry, long at support on a bounce and short at resistance on a correction is a valid opportunity if volume picks up. On these trades, a stop loss just the other side of the key level entry will ensure the positions become nullified if sentiment reverses.
Looking at things from a breakout perspective, a close above resistance will signal a long entry towards an initial upside target of 842. Conversely, a short entry will signal if price closes below 822. A target on this latter position at 815 looks good. Just as with the intrarange trades, a stop loss one or two dollars the other side of the entry keeps things tight from a risk management perspective.
Charts courtesy of SimpleFX