

Okay then. The middle of the week is here, and it’s time to take stock of what’s happened so far, and what is likely to roll out across the next couple of days. Things have been pretty up and down so far. We started out the week with some relatively flat action, but this matured into some volatility pretty quickly. The volatility, we were able to take advantage of, and we have managed to get in and out of the markets according to the rules of our strategy (primarily breakout) on a number of occasions so far. With any luck, we’ll get a continuation of this volatility today, and – further – into the latter half of the week. If we don’t, we’re going to bring our intrarange strategy into play, and see what happens. That is a forward strategy, however, so for now, let’s focus on what’s near-term.
Take a look at the chart below in order to get an idea of the levels we are focusing on for this morning’s session. It is a five minute chart, and it has our intraday range overlaid in green.
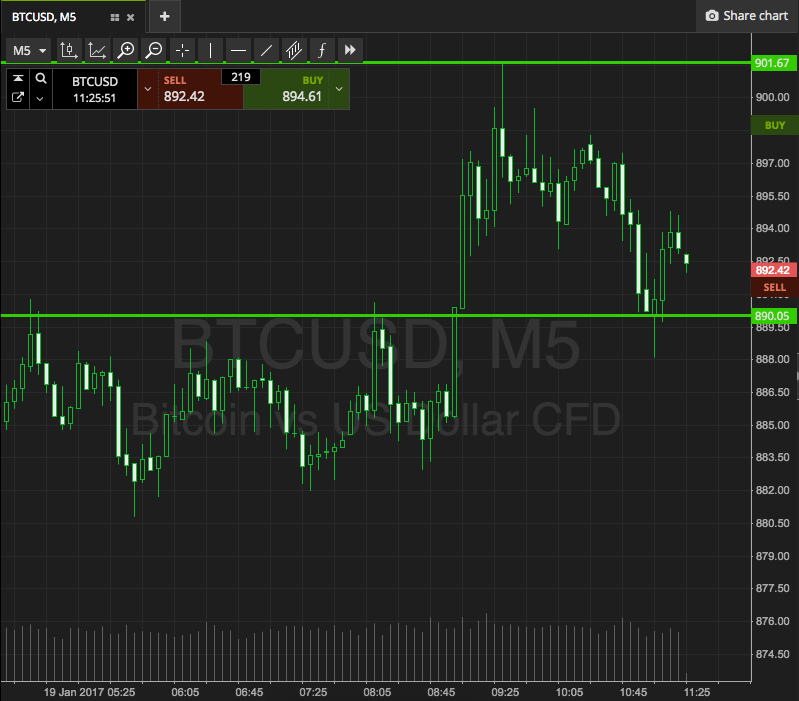

As the chart shows, in response to overnight action, we are now looking at support to the downside around 890 and resistance to the upside at 901. A 900 resistance may be a little more sensible, but we are working on the theory that if price breaks 901, it is going to run further, whereas if we were just focusing on 900, we may see a false break and a correction based on the strength of the level itself.
So, if price breaks 901, we will enter long towards and immediate upside target of 910. A stop loss on the trade at 897 defines risk. Conversely, a close below support will put us short towards 882. On this one, a stop loss at 893 looks good.
Charts courtesy of SimpleFX