Well, it seems as though price just doesn’t want to go where we want it to go. We were hoping for some upside action yesterday evening, and quietly looking at a break of the 1100 level to get us moving in a bullish direction.
As things turned out, that wasn’t what happened.
Price pretty much collapsed through the evening and then into this morning’s early session out of Europe, and we saw a break of 1000 flat as the markets opened in Europe. What this means for price going forward remains to be seen (this author thought there would be plenty of buy strength in and around the 1000 level, and so hopefully we will see that hold as support near term.
Anyway, let’s get some levels outlined for the session this morning, and see if we can sort out a profitable strategy near term.
As ever, take a quick look at the chart below to get an idea of what is on and where we are looking to trade the bitcoin price if and when it moves today.
The chart is a five-minute candlestick chart and it’s got our key range overlaid in green.
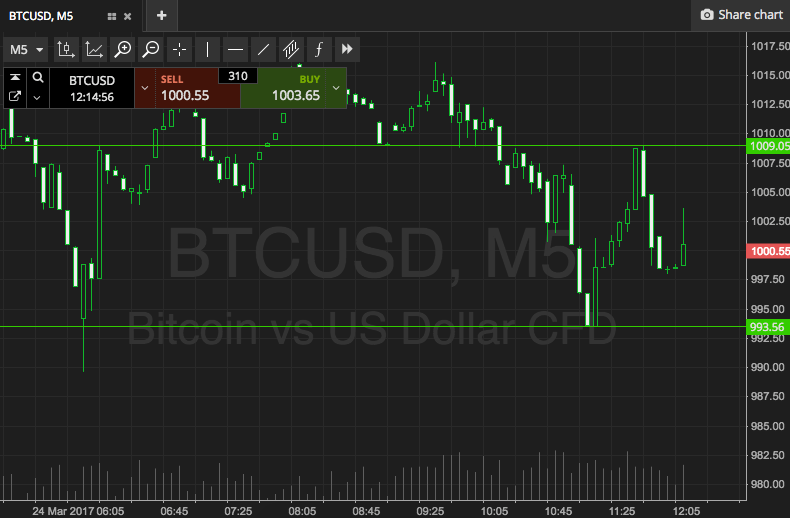

As the chart illustrates, our range in focus for the session today is defined by support to the downside at 993 and resistance comes in to the upside at 1009. With the 1000 level straddled by this range, action may be a bit frictional between our key levels, but we won’t let that change our forward strategy.
So, if we see a break above support, we will look to get in long towards an immediate upside target of 1020. Conversely, a close below support will get us in to a short trade, and we’ll target 980 on the position.
A stop loss on both trades will ensure we are taken out of the position in the event of a bias reversal.
Charts courtesy of SimpleFX