Overnight action in the bitcoin price saw a run up towards the 1070 region, and almost brought 1100 into play as an upside trade. As the European session kicked off, however, price reversed (topped out) and dipped to in and around the 1020 region – a level around which we’re trading right now.
The hope is that today price can hold up above 1000 flat, with the latter being a pretty psychologically significant support. If we see a break below 1000, it’s going to suggest some weakness heading into the weekend. Against a backdrop of some fundamental weakness (hard fork potential, ETF worries from a couple of weeks ago), this wouldn’t bode well.
If, on the other hand, price holds above 1000, then chances are we’ll see a break of 1100 before we see a break of 1000.
Anyway, that’s for the near term future. Let’s get some levels outlined for today’s session, and see what we can set up for the European afternoon. As ever, take a look at the chart below to get an idea of what’s on, and where we are looking to get in and out of the markets according to the rules of our intraday strategy.
It’s a five-minute chart, and it’s got our key levels overlaid in green.
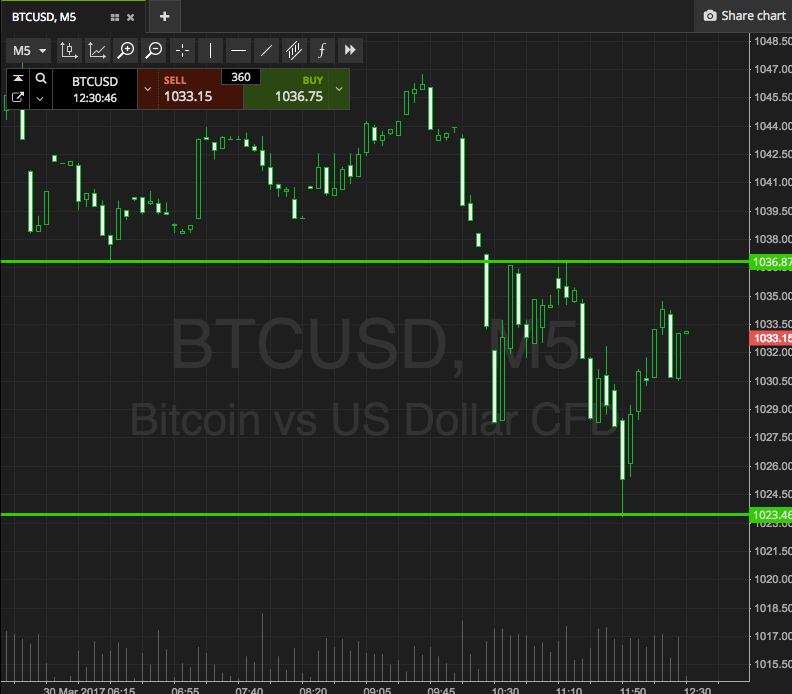

As the chart shows, the range in focus for today’s session is defined by support to the downside at 1023, and resistance to the upside at 1036. There’s just about enough room to go at price intrarange, so long at support and short at resistance, targeting the opposing levels.
From a breakout perspective, if we see a close above resistance, we’ll get in long towards an immediate upside target of 1050. Conversely, a close below support will get in short towards 1010. Stops just the other side of the entry to define risk.
Charts courtesy of SimpleFX