So we’re off on another day’s worth of trading in the bitcoin price and it looks as though we could be in for a pretty volatile one. Things have been pretty up and down overnight and – seemingly through some industry-wide technological issues – price is taking a bit of a hit right now. Whether this will continue to play out in the same fashion throughout the session today remains to be seen, but if there was a recipe for action then this is it. If price does continue to fall, it’s going to give us an opportunity to get in on the break and ride out to a downside profit. If, on the other hand, we get a return to the overarching upside momentum, we’ll be in a similar position but in the opposite direction.
So, with this noted, let’s try and get things in place for the session. As ever, take a quick look at the chart below before we get started so as to get an idea of what’s on and where things stand right now.
It’s a one-minute candlestick chart and it’s got our key range overlaid in blue.
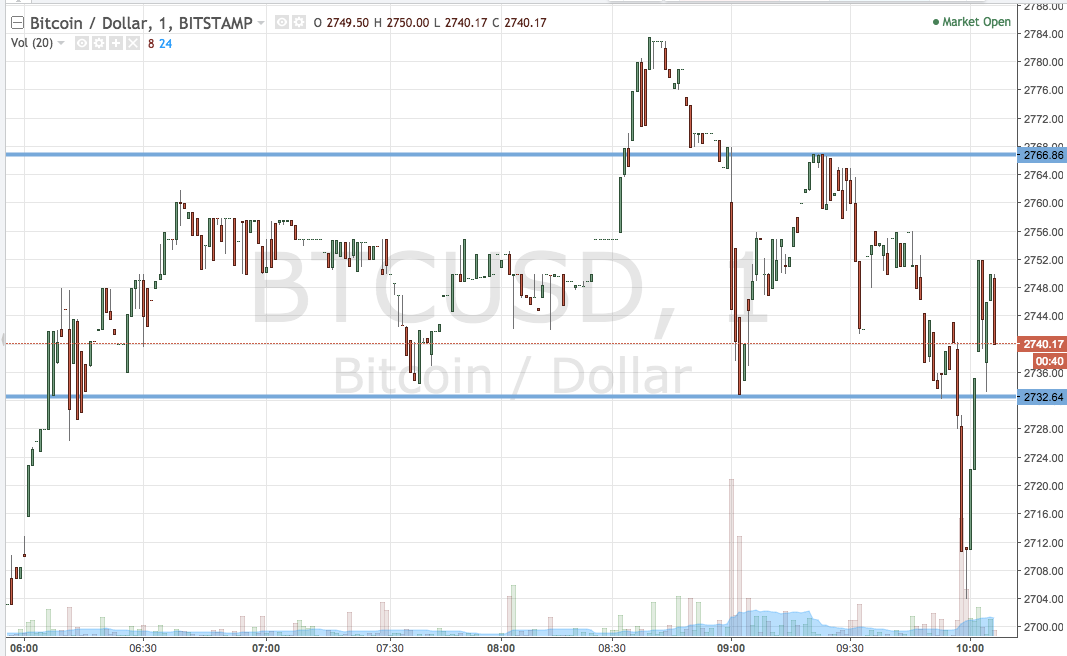

As the chart shows, then, the range we’re going for today is defined by support to the downside at 2732 and resistance to the upside at 2766. There’s probably just enough room to go at price with an intrarange strategy on this range but, primarily because of the volatility we’ve seen overnight, we’re going to stick with our breakout approach. Specifically, if we see price break through resistance, we’ll be in long towards an upside target of 2790. A stop at 2755 looks good from a risk management perspective.
Looking the other way, a close below support will have us in short towards 2720. A stop on this one somewhere around 2740 works well.
Charts courtesy of Trading View.