Let’s get things moving for the session today out of Europe. It has been around 15 or so hours since we last looked at the action in the bitcoin price and – overnight – things have moved pretty sharply. Price is currently trading in and around the $2400 mark, a level not seen for a week or so, and it looks like we are getting a longer-term return to the upside momentum that dominated action over the last few months.
If this is the case, we want to get into the detail pretty quickly today because the price is currently trading just shy of our target resistance level and we don’t want to miss an entry.
So with this noted, let’s get a look at where we are looking to get in and out of the markets according to the rules of our intraday strategy for the session today. As ever, take a quick look at the chart below before we get started so as to get an idea of what is on and where things stand right now. It is a one-minute candlestick chart and it has our key range overlaid in blue.
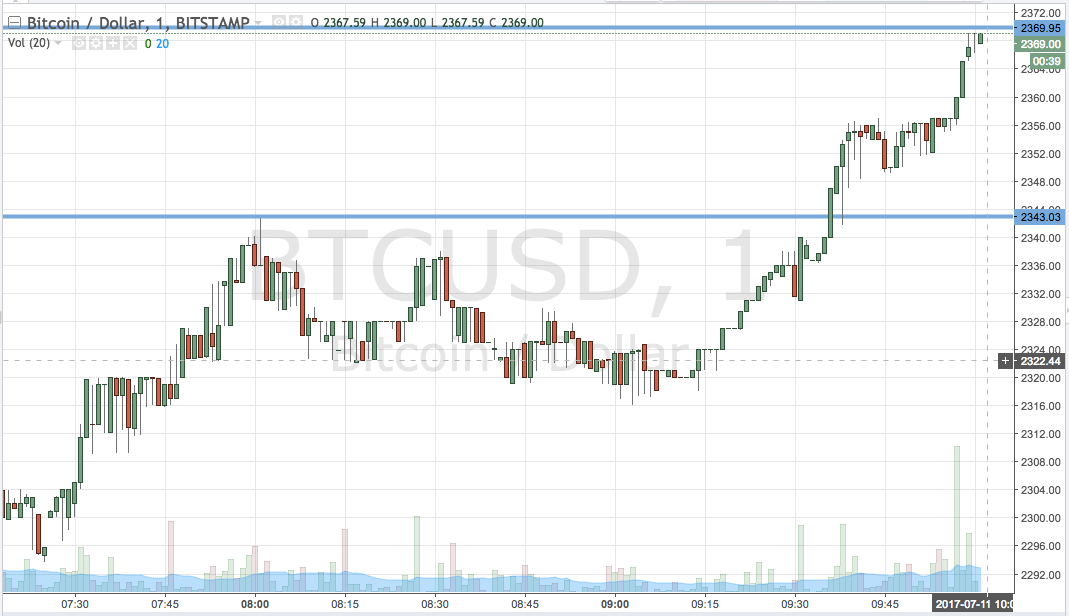

As the chart shows, the range we are focusing on for the session today is defined by support to the downside at 2343 and resistance to the upside at 2369. We will initially look for a close above resistance (as per our strategy mentioned above) to validate an immediate upside target of 2390. A stop loss on the trade somewhere in the region of 2360 works to define risk and will ensure that we are taken out of the position in the event of a bias reversal.
Looking the other way, if we see price close below support, we will get into a short trade towards a downside target of 2320. A stop on this one at 2350 looks good.
Charts courtesy of Trading View
SaveSave