So that’s the end of the week here and it’s been a pretty interesting one in the bitcoin price to date. Anyone who caught yesterday’s analysis will know that we set $5000 in our sights during the European session. As it turned out, the bitcoin price wasn’t quite able to reach those highs, but we did see some pretty strong bullish momentum throughout the session and – with any luck – we’ll get the final kick we need during the European session today to get things really moving.
We have some pretty solid levels in place given the up and down volatility overnight so we should be able to jump in on some reasonable entries if these breaks come in to play.
So, let’s get a key rage outlined and set forth a strategy for the session. As ever, take a quick look at the chart below to get an idea what’s on and how action overnight played into the session this morning. It’s a one-minute candlestick chart and it’s got our range overlaid in red.
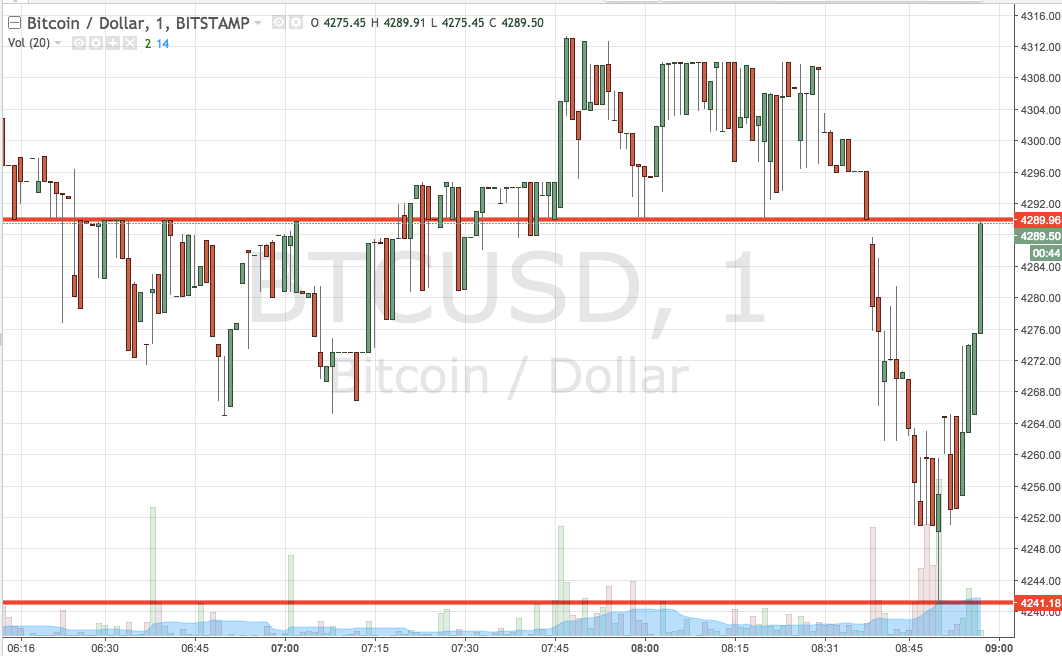

As the chart shows, the range we are going at during the session today comes in as defined by support to the downside at 4241 and resistance to the upside at 4289. Standard breakout rules apply, so we will initially look for a close above resistance to get us in long towards an immediate upside target of 4310. A stop on the position somewhere in the region of 4275 will ensure we are taken out of the position in the event of a bias reversal.
Looking the other way, a close below support will have us in short towards a target of 4200 flat. A stop on this one somewhere in the region of 4248 will serve to kill of risk if things reverse against us.
Let’s see how things play out.
Charts courtesy of Trading View
SaveSave