That’s another week underway now in the bitcoin price and it’s time to take a look at the markets and see if we can use the action that we saw over the weekend to form a bias on any forward volatility. Things towards the end of last week settled down a little bit and we saw price correct somewhat heading into the session on Saturday. Throughout the Sunday evening and early Monday part of the weekend, price dropped to below the 4000-threshold temporarily, but early morning trading out of the UK has brought things back in play above 4000 and we could be in for a reversal of the recent downswing and a return to the overarching upside momentum as things get moving today.
Let’s get some levels in place that we can use to draw profit from the market if and when we see any such volatility. As ever, take a quick look at the chart below before we get started so as to get an idea what’s on and where things stand. It’s a one-minute candlestick chart and it’s got our key range overlaid in red.
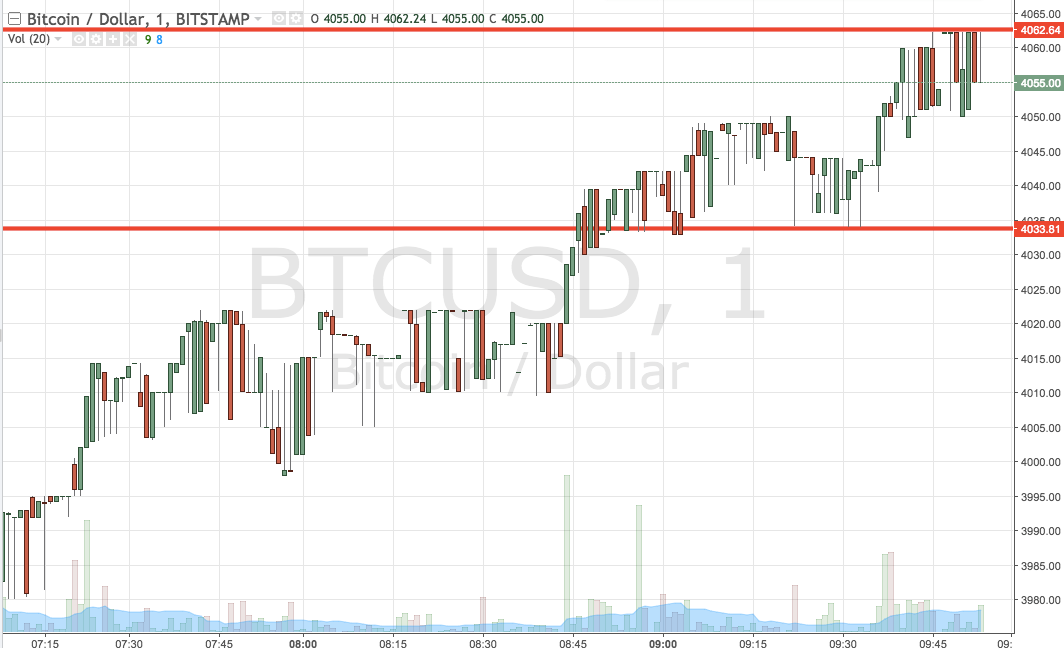

As the chart shows, the range we are focusing on for the session today comes in as defined by support to the downside at 4033 and resistance to the upside at 4062. Standard breakout rules apply for the session, so we’ll be looking at getting in long towards a target of 4100 if we get a close above resistance and – conversely – we’ll be entering short on a close below support. On this second trade a target somewhere in the region of 4000 flat looks good. A stop loss on both positions just the other side of the entry will ensure we are taken out in the event of a bias reversal.
Let’s see how things play out.
Charts courtesy of Trading View