It’s Tuesday morning and time to take our first look of the day at the bitcoin price. Our intraday strategy fared pretty well overnight, with the markets serving up a number of opportunities to jump in and out of the markets for quick turnaround (and relatively low risk) profits. Whether we’ll get a continuation of this sort of action going forward is unclear, but so long as we are able to apply the same sort of framework to the market as we did overnight things should run smoothly.
As ever, take a quick look at the chart before we get started It’s a one-minute candlestick chart and it’s got our ley range overlaid in red.
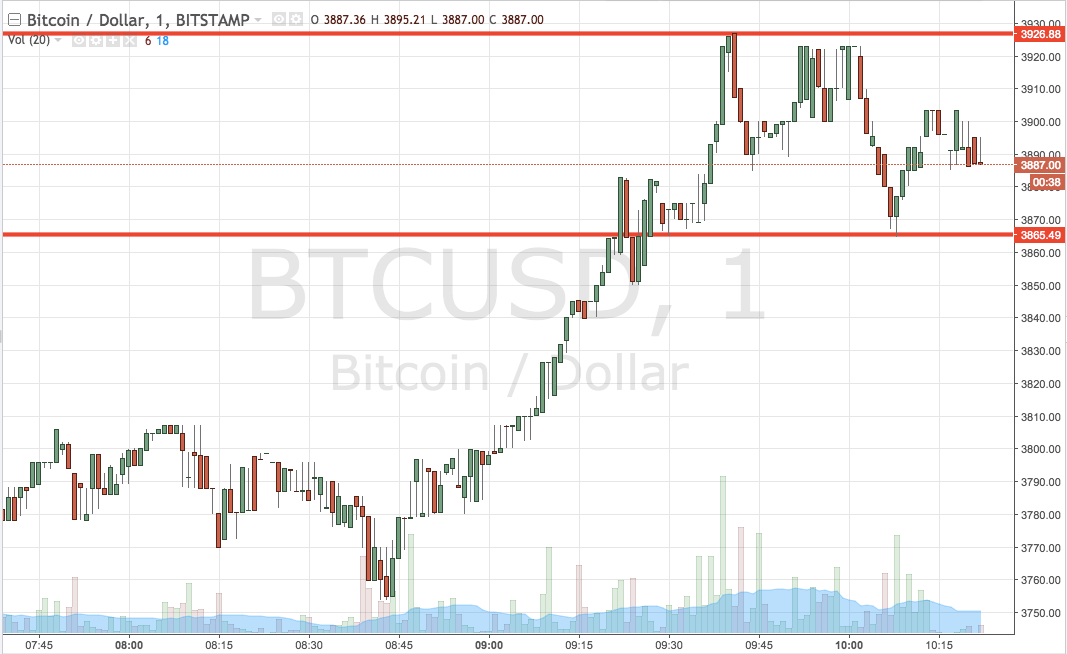

As the chart shows, the range we are using for the session today comes in as defined by support to the downside at 3865 and resistance to the upside at 3926. Compared to some of the ranges we’ve used over the last month or so, this one’s relatively tight. As such, we’ve got to make sure our risk management parameters leave us just enough room to avoid chop outs but ensure we are taken out of any positions in the event of a bias reversal on any trades we enter. So, if we see price break through resistance, we’ll jump in long towards an immediate upside target of 3970. A stop loss on the trade somewhere in the region of 3910 takes us out if things turn against us.
Looking the other way, a close below support will have us in short towards an immediate downside target of 3810. There’s a little bit more reward on offer heresy we can be a little less strict with out stop. Somewhere in the region of 3880 looks good.
Let’s see how things play out.
Charts courtesy of Trading View