Around this time last year, the bitcoin price got stuck in a cycle of up-and-down action followed by periods of drawn out consolidation. The cycle came on the back of a variety of different news inputs, with both positive and negative sentiment playing the way price moved.
As we head into the middle of this week, it looks we are in the midst of a similar sort of pattern.
Price cannot seem to decide an overarching direction and return it looks as though it might’ve done, we see some consolidation and – eventually – a reversal. This isn’t necessarily a bad thing. When you trade short-term charts, volatility is what matters, not overarching direction. It does make breakout trades a little more difficult because we cannot guarantee that price going to run to a substantial degree in the direction of the road. So long as we keep our targets relatively modest, however, there’s no real problem. Sure, it is a bit frustrating sometimes, but what else do expect from the markets?
Anyway, let’s get going for the session today.
As ever, take a quick look at the chart below before we get started so as to get an idea of what is on and where we are looking to get in and out of the markets according to the rules of our intraday strategy. It is a one-minute candlestick chart and it has our key range overlaid in green.
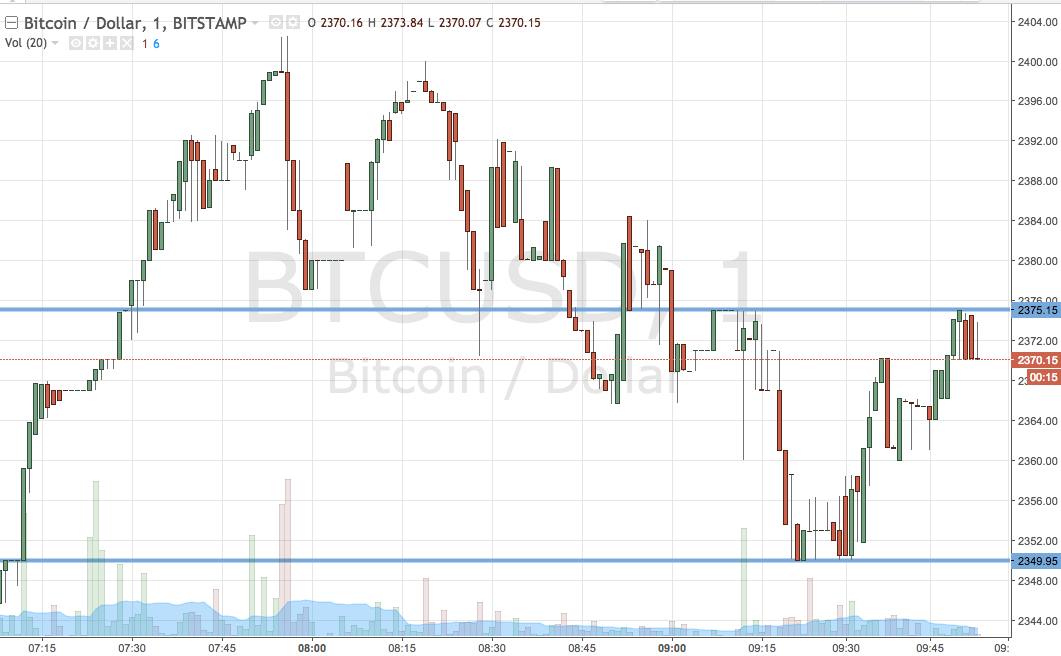

As the chart shows, the range we are using for the session today is defined by support to the downside at 2349 and resistance to the upside at 2375. If we see a close above the latter, we will enter long towards 2400 flat. Conversely, a close below the former will have us in short towards 2320. Stop losses on both positions will ensure we are taken out of the trades in the event of bias reversal.
Charts courtesy of Trading View
SaveSave