Okay, we’re off to a fresh start for the week in our bitcoin trading, and it is time to take a look at what’s happened over the weekend, and see if we can figure out where we expect price to go during today’s European morning session. With any luck, we will get some volatility, and be able to get in and out of the markets according to our intraday strategy. Over the weekend, price remained relatively flat, and we didn’t see that much in the way of breakout action. We did manage to get in on a couple of short term trades, but nothing spectacular, and hopefully during today’s session things will pick up a bit. The low-volume action is represented by the strange looking charts.
So, as we move forward, let’s take a look at where we are looking to get in and out the markets today, and see if we can’t draw a profit from any action.
As ever, take a quick look at the chart below to get an idea of what is on. It is a five-minute candlestick chart, and it has our range in focus overlaid in green.
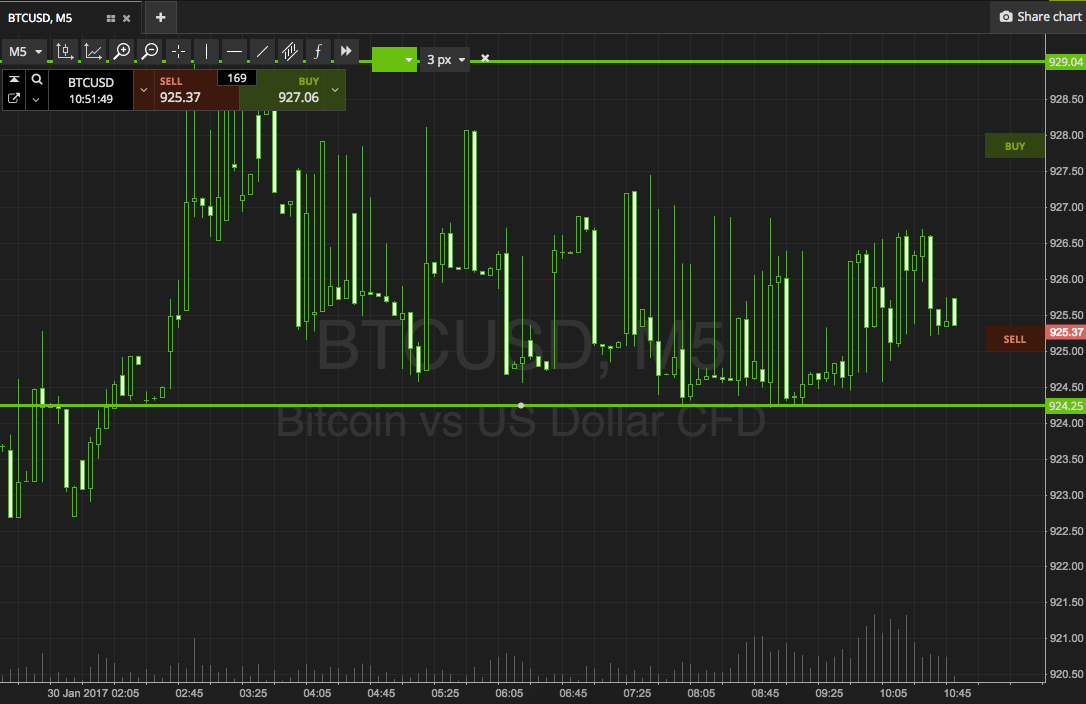

As the chart shows, the range we are looking at for today’s session is defined by support to the downside at 924, and resistance to the upside at 930. This is a very tight range, so break out only for today’s session.
Specifically, if we see price break above resistance, we will enter long towards an upside target of 940. A stop loss on the trade at 927 defines risk. Conversely, a close below support will put us in short towards 915. On this one, a stop loss at 927 will ensure we are taken out the trade in the event of a bias reversal.
Let’s see how things play out.
Charts courtesy of SimpleFX.