So that is another day done in our bitcoin price trading efforts, and yet again, we have had another big one. We are not sure what the reason is for price continuing to appreciate as it has done over the last week or so – it is likely a combination of things. The potential for a hard fog softening (or at least, that is, slipping out of traders’ sphere of awareness) and the acknowledgment of mainstream media that price is picking up are both likely factors playing into the situation.
Whatever it is, it has given us plenty to trade, and that bodes well going forward. So, we are not going to spend too much time looking at price today (by this, we mean, price that has already come before the current time).
Instead, let’s just get right to the detail and set up a strategy with which we can carry forward into this evening’s session.
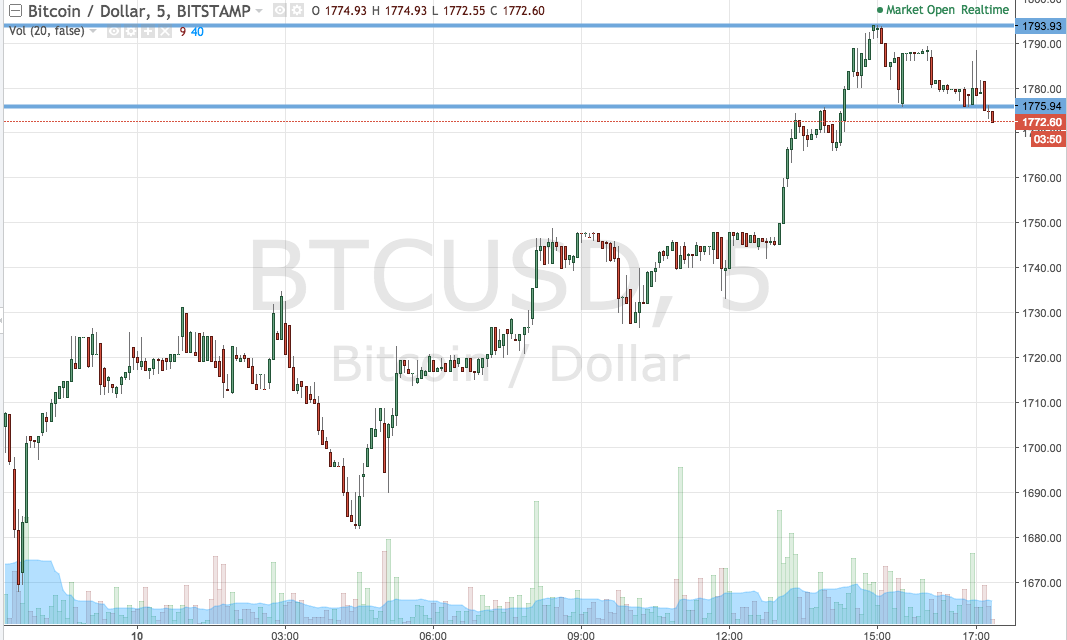

Take a look at the chart below to get an idea of what is on, and where we are looking to get in and out of the markets according to the rules of our intraday strategy. It is a five-minute candlestick chart and it has our key range overlaid in green.
As the chart shows, the range we are looking at this evening is defined by support to the downside at 1775 and resistance to the upside at 1793. We are going to go with our standard breakout approach for now, so if price breaks above resistance, we will look to enter long with a target of 1810. A stop loss on the trade at 1787 looks good. Conversely, if price breaks below support, we are going to get in short towards an immediate downside target of 1760. On this one, a stop loss at 1780 works to keep our risk defined in the event of a bias reversal.
Chance courtesy of Trading View