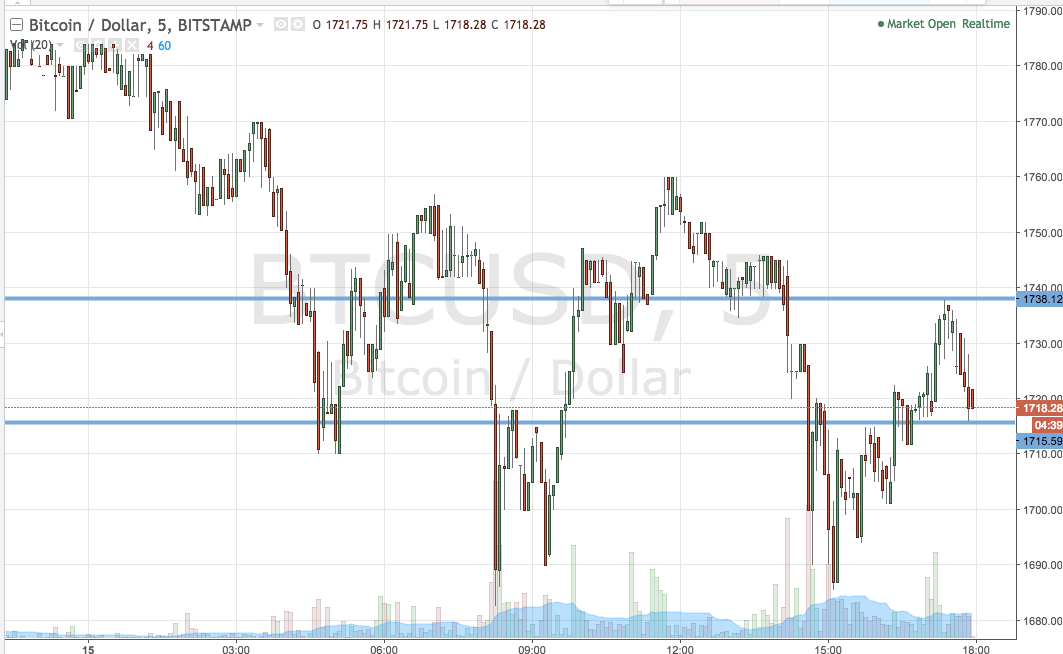
So that’s another day done in in our bitcoin price trading efforts, and – yet again – we’ve had a pretty interesting one. When we set up our key levels this morning, we were coming into the session off the back of a temporary correction, and we were able to pick up a couple of points on a bounce. This correction now looks finished, and we have a relatively straightforward range with which to go at price this evening. So, let’s get some levels outlined with which we can attempt to draw a profit from the market on any volatility tonight. As ever, take a quick look at the chart below to get an idea of what is on. It is a five-minute candlestick chart, and it has our key range overlaid in green.

Looking at our breakout strategy, if we see price close above resistance, we will look to get into a long trade towards an immediate upside target of 1750. A stop loss on the trade at 1734 defines risk nicely. Looking the other way, a break below support will have us on the lookout for a close below that level, and if we see the close, we will enter short towards a downside target of 1720. On this one, a stop loss at 1740 looks good.
Chart courtesy of Trading View