So here goes, our final bitcoin price analysis of the week. It has been a pretty busy week, as we noted earlier today, and one that will likely end up influencing our trading for weeks to come. Why? Because action has been so volatile that it has carved out numerous key levels, and we can use these key levels to carry forward into our trading throughout the remainder of January. Exactly which of them will become effective remains to be seen, but no doubt some of them will, and when they do, we will be ready to take advantage. Anyway, chances are many reading are looking forward to getting their weekend started, so we won’t take too long. All we’ll do is outline our key levels for this evening session, and maybe something to watch over the weekend, and leave it at that. So, take a look at the chart below to get an idea of the levels in focus, and where we intend to get in and out the markets according to our intraday strategy. The cart is a five-minute candlestick chart, and as usual, it has our range overlaid in green.
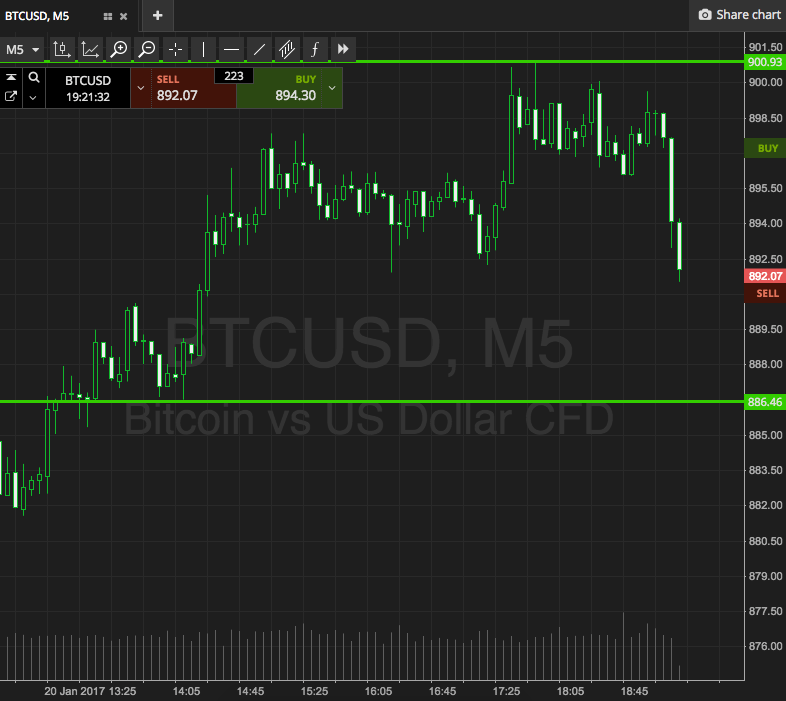

As the chart shows, the range in focus is defined by support to the downside at 886, and resistance to the upside at 900 flat. This is probably just enough room to go at price intrarange, but we’re going to stick with breakout for this evening. So, if we see price break through resistance, we will enter long towards an upside target of 910. On this one, a stop loss somewhere in the region of 897 should kill off our downside risk in the event that price turns around and trades against our upside bias. Looking the other way, if price breaks through support, we will get in short towards a downside target of 875. Again we need a stop loss, and 889 looks good.
Charts courtesy of SimpleFX