Here we go then – a fresh week of trading in the bitcoin price, and it looks as though we are going in to this one in a similar position to which we closed out the last. Price has been somewhat erratic over the last week or so, but not to the point that we’ve had any real sustained momentum. The opposite is true, really. We’ve seen things move, and we’ve been able to get in and out of plenty of positions (and profitable ones, at that), but price hasn’t really changed all that much across the trades we’ve made. To put this in another way, we’ve had a sort of range bound period, and we’ve been getting in and out of the markets on a type of range within a range approach.
Anyway, we’re rambling on a little here.
Let’s get to what’s important – how we are going to approach bitcoin today, and where we are going to get in and out of the markets as and when things get moving. As ever, take a quick look at the chart before we get started to get an idea of where things stand right now, and what happened over the weekend.
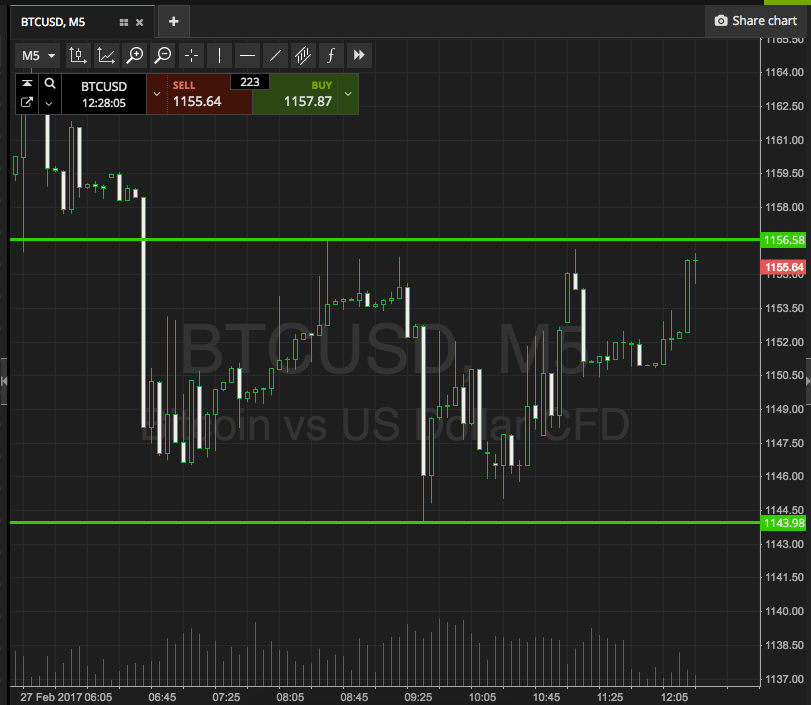

As the chart shows, action over the weekend gave us much of the same. Medium volume, relatively tight range, but still some up and down action. It’s given us a range to go at for today’s European session as defined by support to the downside at 1143, and resistance to the upside 1156.
Usual entries apply for the session – if we break above resistance, we’ll be in long towards an upside target of 1166, whereas a close below support will get us in short towards 1132. A stop loss on both positions just the other side of the entry will ensure that we are taken out of the trade if price reverses against our bias.
Charts courtesy of SimpleFX