We are closing in on the end of another week, and it hasn’t been a particularly good one so far from a long-term valuation perspective. The bitcoin price continues to correct from highs registered towards the end of last week and currently trades in and around the 2500 mark. What started out as a relatively minor correction is now becoming pretty substantial, and while price remains well within the parameters necessary to consider the recent run a solid one, it looks as though profit-taking may push things down a little farther before the correction bottoms out. The question is, how far will things fall? The answer, of course, is that we don’t know – at least not right now. We are monitoring price closely for any indication of a near-term bottom, but as yet, we have not seen one. From a short-term trading perspective, it doesn’t have too much of an impact on the way we approach the markets. If anything, it just means we have to keep our upside risk pretty narrow, as the overarching momentum seems to be with the Bears right now.
So, with all this noted, let’s try and outline some levels with which we can approach price during the session today. Take a quick look at the chart before we get started to get an idea of where things stand.
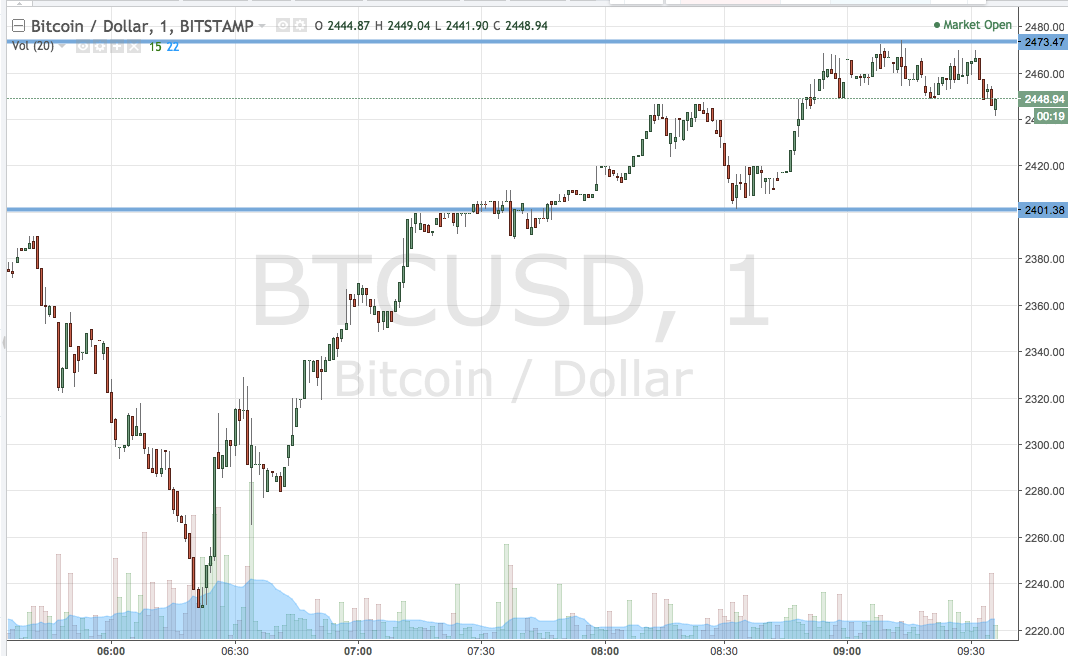

As the chart shows, the range we have in our sights for today is defined by support to the downside at 2401 and resistance to the upside at 2459. Standard breakout rules apply for the session today, so we will look to enter long on a close above resistance towards an upside target of 2475. A relatively tight stop loss, somewhere in the region of 2452, looks good. Looking the other way, a close below support will get us in short towards 2375. Again we need to keep things quite tight, so a stop loss 2410 defines risk nicely
Charts courtesy of Trading View