In this morning’s analysis, we noted that the bitcoin price seemed to have settled down a bit, and was carving out a relatively tight range. In turn, we highlighted the fact that this range might present us with a nice opportunity to get in and out of the markets on a breakout position during the early European session this week, and that we would be on the lookout for any such positions as the day’s trading matured. As things turned out, we haven’t had any real breakout opportunities, but we have seen a continuation of the sideways momentum, and this has served to strengthen our key levels going forward.
So, with this in mind, and as we head into this evening’s session, here is a look at what we’re focusing on in the bitcoin price, and where we will look to get in and that the markets according to our intraday strategy. As ever, take a look at the chart below to get an idea of what we are looking at. It is a five-minute chart with our key levels overlaid in green, showing somewhere in the region of the last 8 to 12 hours’ worth of bitcoin price action.
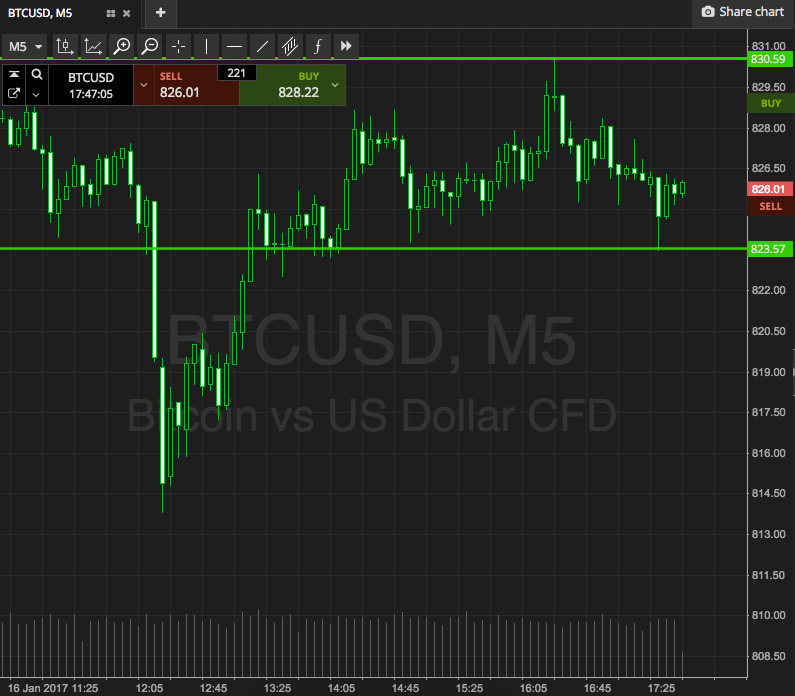

As the chart shows, the range we are looking at this evening is defined by support to the downside at 823, and resistance to the upside at 830. This range isn’t quite wide enough for us to bring our intrarange strategy to the table, so we will be going at price with a breakout strategy only.
Specifically, if we see price break through resistance, we will enter long towards an immediate upside target of 840. A stop loss on the trade at 828 defines risk. Conversely, a close below support will signal short towards 812. Again we need a stop loss, and somewhere around 825 looks good.
Charts courtesy of SimpleFX