In this morning’s analysis, we noted that the action we have seen in the bitcoin price over the last few weeks has been incredibly volatile. We pointed out that this volatility could make trading difficult going forward, unless price settled down a bit, and consolidated somewhat. We also highlighted the fact that action overnight last night suggested that this consolidation might be just around the corner, and – if it was – we might have an opportunity to take a breather and try and bring our intrarange strategy in to play (we haven’t really been able to as late, as price has moved too quickly, and we have been restricted to our breakout approach). Action today has sort of reinforced this. Price traded sideways for the majority of the day, and currently sits between a pretty tight range. The tightness of the range means we probably wont be able to bring intrarange into play this evening, but it bodes well for tomorrow morning, when things kick off again.
For now, however, let’s just focus on breakouts, and try and put together some levels for this evening’s strategy. As ever, take a look at the chart below to get an idea of what is on. It is a five-minute candlestick chart, and it has our range overlaid in green.
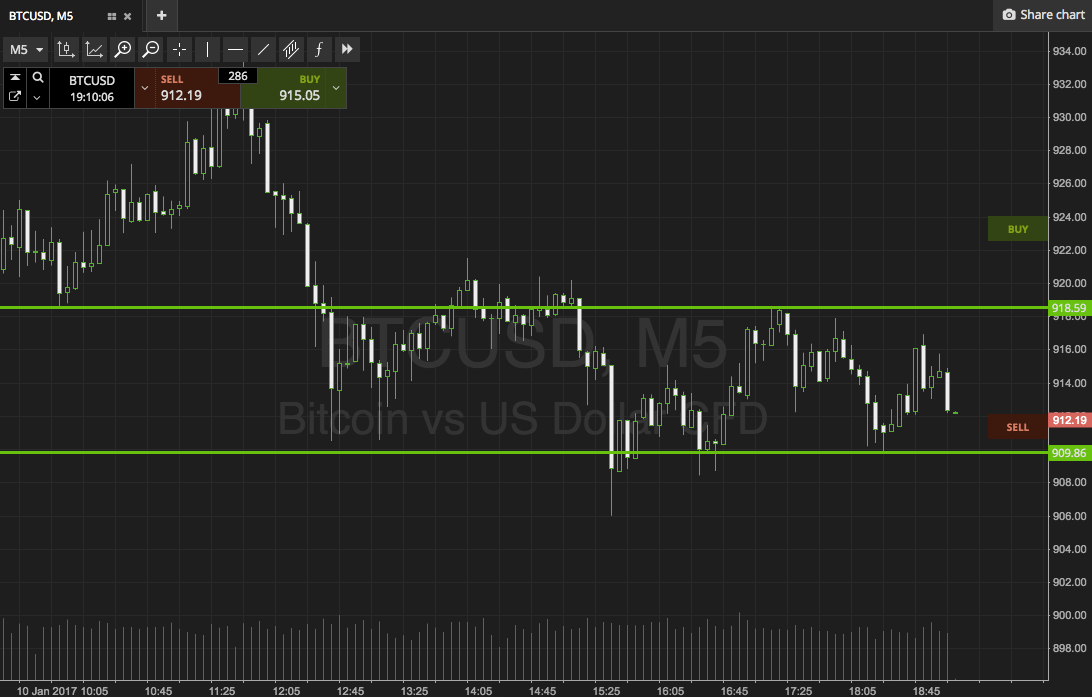

As the chart shows, we are looking at support to the downside at 909 and resistance to the upside at 918. If we see price close above resistance, we will look to get in long towards an immediate upside target of 928. A stop loss on the trade at 915 risk. Conversely, a close below support will signal short towards 900. A stop loss on this one somewhere in the region of 913 will ensure that we are taken out of the trade in the event that price reverses to trade against us.
Charts courtesy of SimpleFX.