After what was a pretty rough start to the week, we’re finally seeing the bitcoin price start to reverse and pick up strength. Things looked like they might be in a bit of trouble over the weekend as price collapsed a couple hundred dollars and – subsequent to the collapse – markets picked up on the news and started to sell off on the digital currency further. The action we have seen subsequent to this decline, however, demonstrates the degree of strength that exists right now in the market. Price bottomed out on Monday and – despite a wave of negative sentiment as brought about by wider market media coverage – things are now looking strong and we’re getting a return to the upside momentum.
The hope is that this momentum will continue as we move forward into the middle of the week and beyond. If it does, we could be in for a pretty nice run and one that would come as a welcome reprieve after what happened last week.
So, with all this noted, let’s get to the key levels we are looking at this evening. As ever, take a quick look at the chart below before we get started to get an idea what’s on and where things stand right now. It’s a one-minute candlestick chart and it’s got our key range overlaid in blue.
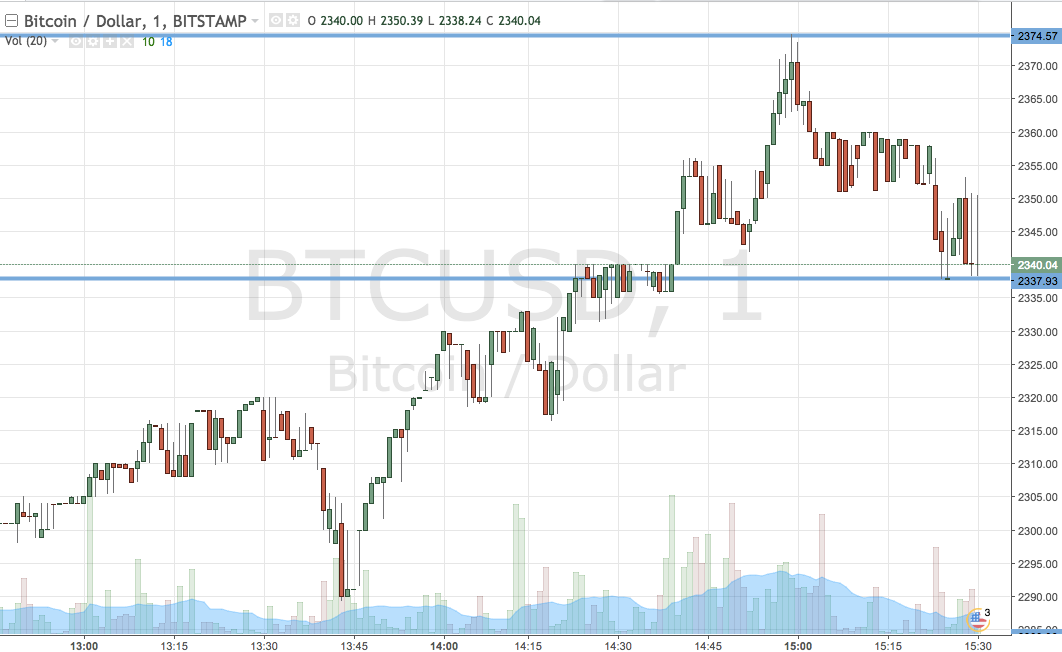

As the chart shows, the range we are going at the markets with this evening comes in as defined by support to the downside at 2337 and resistance to the upside at 2374. We will look for a close above resistance to put us in long towards an immediate upside target of 2400. Conversely, a close below support will have us in short towards a downside target of 2300 flat.
Stops on both entries will ensure we are taken out of the positions in the event of a bias reversal.
Charts courtesy of Trading View