Right then. Here we go on a another day in the bitcoin price. At the start of the week, we noted that we hoped price would continue to run as the week matured, and that if it did, we would be ready to get in and out of the markets as and when we broke the 1000 level. This break happened, and brought 1100 into play. We highlighted the latter as a key level to watch overnight, and – as the Asian session kicked off this morning – 1100 broke, and has given us plenty to go at in the process for today’s European session.
We can open our range out a little bit this morning, and look for some degree of sustained momentum to carry things higher in the bitcoin price as price action plays out. So, with this noted, and as we move forward into today’s session, here is a look at what we are focusing on in the bitcoin price, and an analysis of where we intend to get in and out of the markets according to our intraday strategy.
As ever, take a quick look at the chart below in order to get an idea of where our range lies now.
It is a five-minute candlestick chart, and it has our key range overlaid in green.
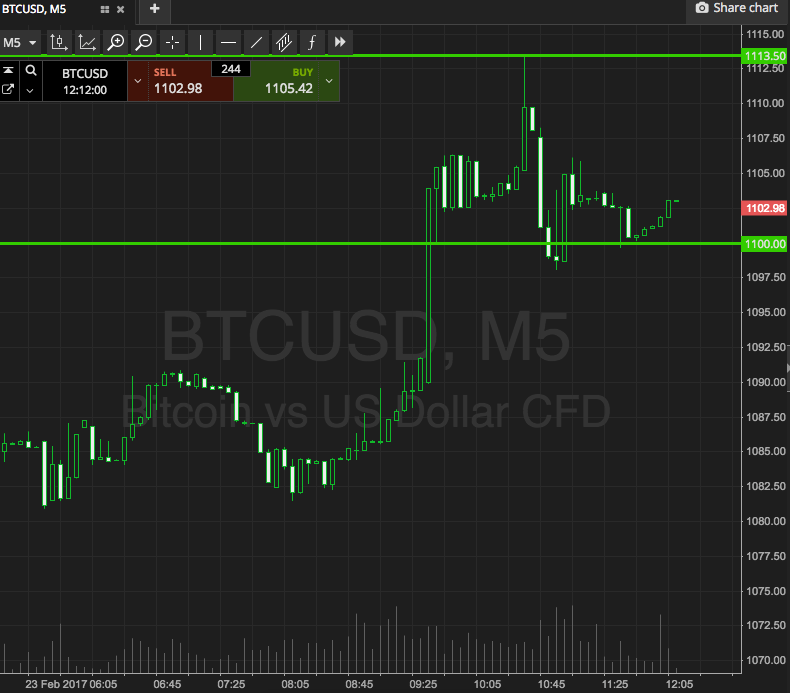

As the chart shows, the range we are targeting for today is defined by support to the downside at 1100, and resistance to the upside at 1113.
So, we will look for a close above resistance to validate a long-term entry towards an immediate upside target of 1125. A stop loss on the trade at 1110 will ensure that we are taken out of the position in the event of a bias reversal.
Conversely, a close below support will signal short towards 1090. Stop at 1103 to kill off our risk on the trade.
Charts courtesy of SimpleFX