The middle of the week is here already and what a week we’ve had so far in the bitcoin price. When things first kicked off on Monday, it looked as though we may be in for some pretty flat action for at least the first 48 hours of play. Sure, we got some volatility over the weekend, but this didn’t translate into the early morning session on Monday and we expected that we might be in for some degree of consolidation near term. As it turned out, we weren’t correct. Price shot out of the gates and immediately found its footing and hasn’t really stopped since. We did see some consolidation early yesterday evening, but this came on the back of a pretty volatile day and – as is generally the case – was simply a rebalancing situation.
So, with this noted, and as we head into the session this morning, here is a look at what we are focusing on in the bitcoin price and where we intend to take advantage of any volatility that comes our way today.
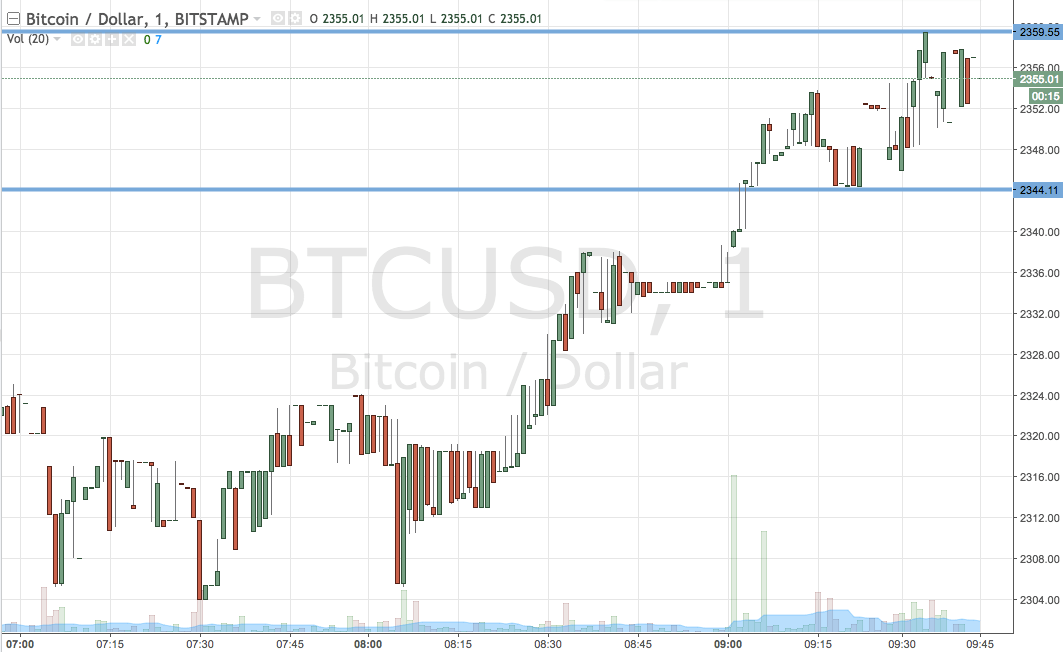

As ever, take a quick look at the chart below before getting started.
It is a one-minute candlestick charting that has our key range overlaid in blue.
As the chart shows, the range we are focusing on for the session today is defined by support to the downside at 2344 and resistance to the upside at 2359. If we see price break above resistance, we will enter a long trade towards an immediate upside target of 2390 flat. Looking the other way, and as per our short entry, if we see price break below support, we will get into a downside trade towards an immediate target of 2305. A stop loss on both trades is necessary to ensure we get taken out of the positions in the event of a bias reversal. Somewhere in the region of $10 just the other side of the entry looks good.
Charts courtesy of Trading View