So that is another day done in our bitcoin price trading efforts, and there’s been very little action worthy of note yet again. As we highlighted this morning, the momentum seen throughout late last week and into the weekend has all but dissipated, and we are now getting a sustained period of consolidation. Sideways trading is far from conducive to breakout entries, and that basically renders our intraday strategy useless temporarily. Sure, we can bring intrarange in to play now and again when conditions are as they are, but for today at least, we were going at too tight a range to do so. In other words, we were trying to force a breakout entry, and it didn’t work.
Anyway, that doesn’t mean we can’t set up against the action and see what comes our way. Our strategy dictates that we maintain a degree of consistency across our efforts (that’s why it’s succesfull, to be honest) so let’s do just that.
Here’s what we are going at this evening, and where we are looking to get both in and out of the markets as volatility plays out and action matures throughout the US afternoon session and beyond. As ever, take a quick look at the chart below before we get started. It’s a five-minute candlestick chart showing the recent, boring action.
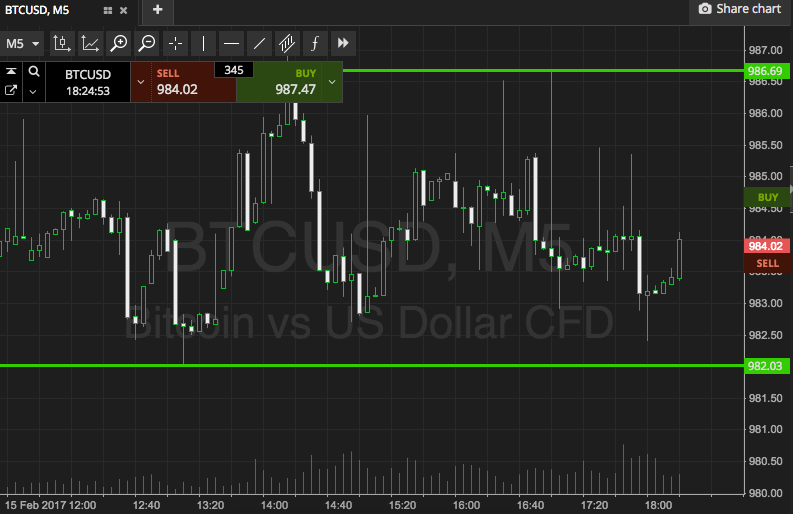

As the chart illustrates, then, we are looking at a range defined by support to the downside at 982 and resistance to the upside at 986 flat. This is a little wider than this morning, but very similar.
If we see price break through our predefined resistance level to the upside, we’ll get in a long entry towards 996. A stop at 983 defines risk on the trade.
Looking short, a close below support signals a downside entry towards, 972. Stop at 985.
Let’s see what happens…
Charts courtesy of SimpleFX