Yesterday evening, in the second of our bitcoin price analysis pieces, we yet again suggested that we might be in for a near-term correction. We had seen some degree of correction early on in the day, but there was no guarantee that this was all we were likely to get on the back of the latest run. We are now heading into the early morning session in Europe on Tuesday, however, and it looks as though that small correction is all that the market could offer. The bitcoin price looks to have returned to its overarching upside momentum, and currently trades in and around fresh highs (yet again) above $1700.
So, as we head into a fresh session today, let’s try and outline some key levels to move forward with in our efforts to draw a profit from the market on any volatility. As ever, take a quick look at the chart below to get an idea of what’s on, and where we are looking to get in and out of the markets according to the rules of our intraday strategy.
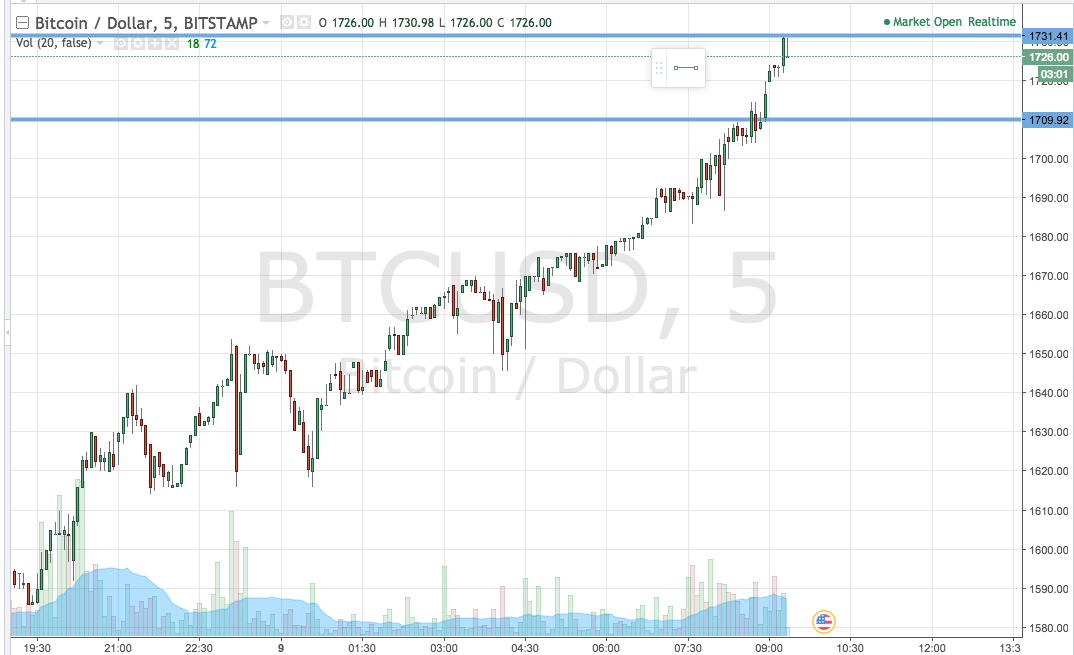

As the chart shows, the range we are focusing on for this morning is defined by support to the downside at 1709 and resistance to the upside at 1731. Just as was the case yesterday, there is plenty of room to go at price with a intrarange strategy on a range this wide. However, we are going to focus on breakout only for the time being. Specifically, then, if we see price break above resistance, we will look to enter a long trade towards an immediate upside target of 1750. A stop loss on the position at 1727 defines risk nicely.
Looking short, a close below support will get us in towards a downside target of 1695. Again we need a stop loss on the trade, and somewhere in the region of 1715 works well.
Charts courtesy of Trading View