We are now closing in on the end of the week, and yet again, we have had an incredibly interesting period in the bitcoin price. Things started to pick up at the beginning of May after a period of short-term correction and it looked as though we might be in for a continued run of strength. However, with corrections always potentially on the cards, it’s generally difficult to figure out just how far any run might go, and what it might mean for the eventual correction that comes around. As yet, what we have seen is a relatively traditional appreciation-type move. That is, traditional in terms of what we might expect from more established financial assets. Higher highs, higher lows, and the odd corrective consolidation phase while markets rebalance.
Overnight last night, we saw much of this same sort of action.
Price broke through our predefined resistance level relatively early on in the evening and ran straight through our upside target. We then got a bit of a correction, and some small-scale consolidation, but nothing dramatic, and it looks as though we are set to see further upside strength in the bitcoin price as action matures throughout the session on Thursday.
So, with this in mind, let’s try and outline some key levels with which we can approach our bitcoin price trading strategy today. As ever, take a quick look at the chart below to get an idea of what we are focusing on. It is a five-minute candlestick chart and it has our key range overlaid in green.
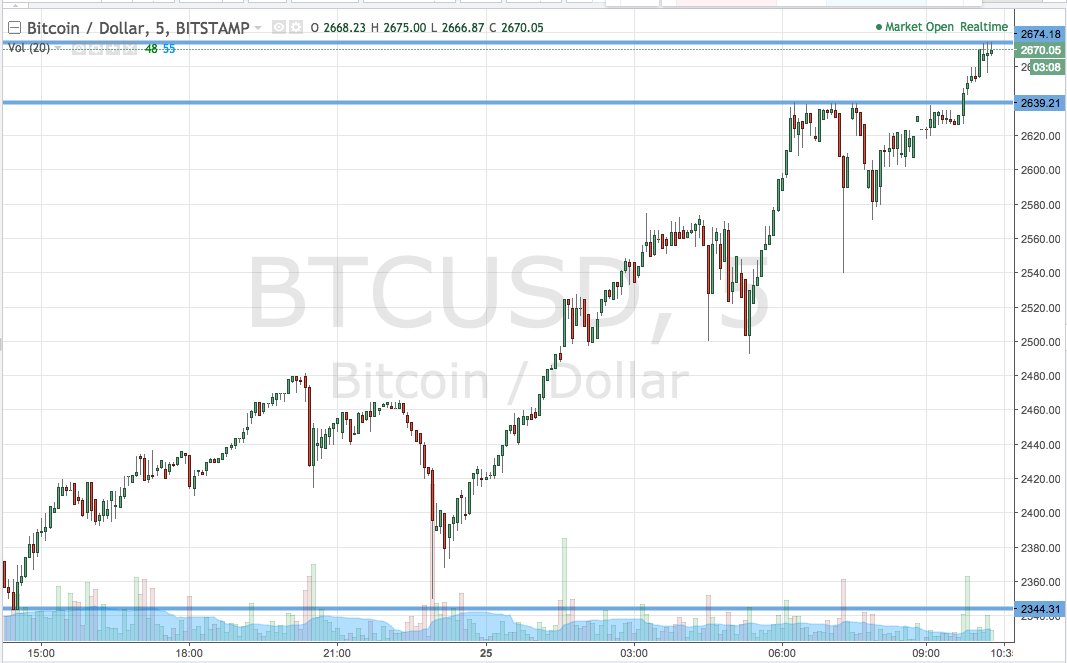

As the chart shows, the range we are looking at is defined by support to the downside at 2639 and resistance to the upside at 2674. If we see a break above resistance, a close above that level will have us in long towards a target of 2700. Conversely, a close below support will get us in short towards a target of 2600.
Charts courtesy of Trading View