So the day has drawn to a close out of Europe, and it’s time to put out the second of our twice daily bitcoin price watch analysis pieces. In this morning’s analysis we noted that action over the weekend (while initially promising) was pretty flat, and that this may continue into the early week trading session today. This is especially true when compared to the action see across last week’s latter half. So, let’s take a look at what happened today, and try to figure out how we can use this to influence our strategy heading forward into the US afternoon and, beyond that, into the Asian session this evening.
As ever, take a quick look at the chart before we get going, It’s a fifteen minute candlestick chart showing the last few days worth of action, and it’s got a fresh range overlaid to show this evening’s key levels.
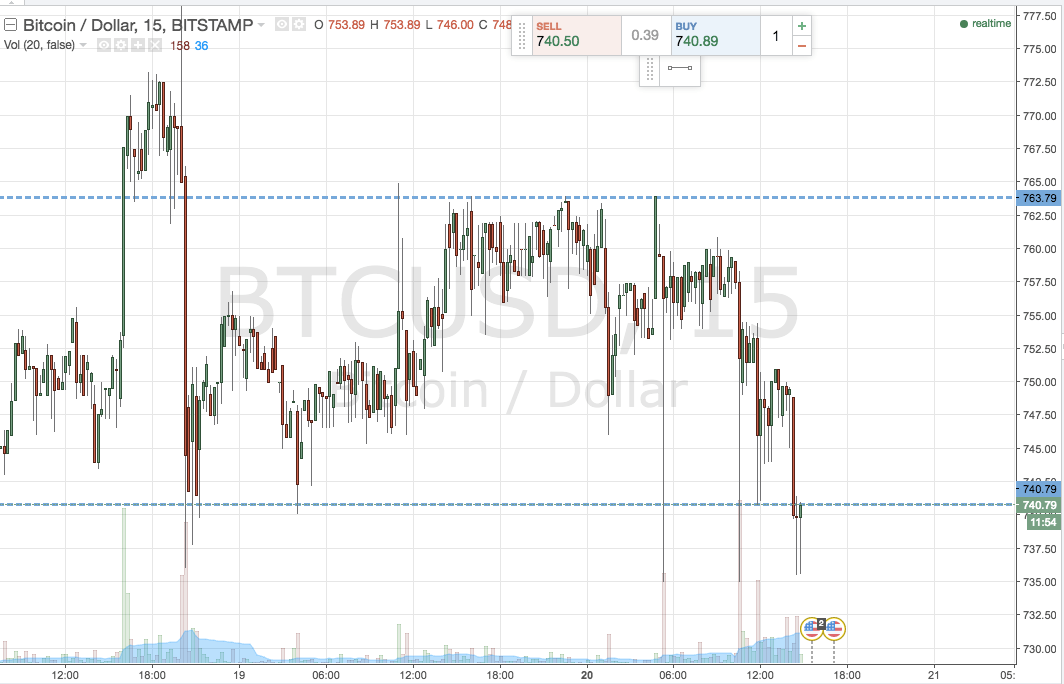

So, was the chart shows, the levels we are focusing on for this evenings session are in term support to the downside at 740, and in term resistance to the upside at 763. It’s a pretty wide range, so we can go at the market with an intrarange strategy while maintaining a pretty decent risk to reward profile. Specifically, long on a bounce from support and short on a correction from resistance. Stop loss just the other side of the entry to define risk.
From a breakout perspective, a close above resistance will signal a long entry towards an initial upside target of 770 flat. A stop loss on the trade at 760 keeps risk tight. Looking short, if price breaks (and closes) below support, it will signal a short trade toward sa downside target of 730 flat. A stop loss on this one somewhere in the region of 745 looks good.
Charts courtesy of Trading view