What can we say about today? The bitcoin price has been pretty erratic over the last forty-eight hours or so. We have attempted to track it and – in turn – trade it across the period in question, but it’s not been easy. Not in the sense that we haven’t been able to get in and out for a profit – our strategy rules make it very difficult NOT to get in and out when action is as up and down as it has been of late – but setting the levels, and making sure our risk reflects the reward we are presenting ourselves with, has been complicated.
All we can do this evening is base our strategy on what we’ve seen this afternoon, and hope that action isn’t too tough on us as and when it plays out.
So, with this in mind, let’s move forward into this evenings session. As ever, take a look at the chart below to get an idea of what’s on, and where we will get in and out of the markets according to the rules of our strategy as things mature throughout the night.
The chart is a five minute candlestick chart and it’s got our range overlaid in green.
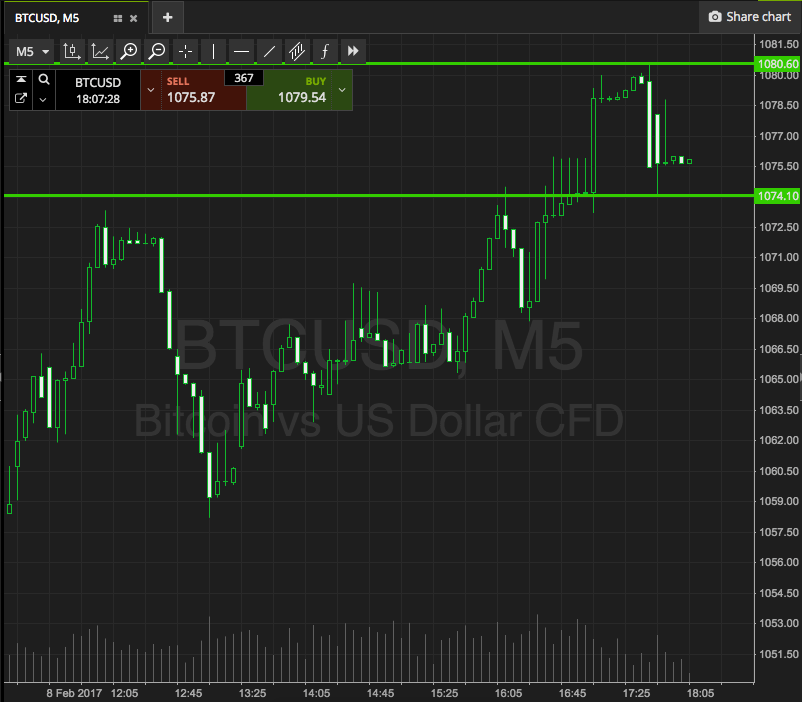

Breakout only, with some real tight stops to keep things as tight as possible.
So, if price breaks through resistance, we’ll get in a long position towards an upside target of 1087. A stop on the trade at 1076 defines risk nicely. Conversely, a close below support will put us short towards 1067. Our stop here is around 1077.
Let’s see how things play out.
Charts courtesy of SimpleFX