So here we go on another day of bitcoin price trading, and it is looking as though things are not going to be too different from what we saw yesterday. For readers who missed yesterday’s coverage, we basically reacted to price declining throughout the weekend, and breaking through a level that we had slated as long-term support around 1100. With this level broken, we had to shift our range to the downside, and reevaluate our entries from a risk perspective. It didn’t limit our entry potential, but we had to tighten things up on our upside stop loss in order to ensure that if we did get a breakout, and then a reversal, we weren’t on wrong the end of an irretrievable loss (in other words, we needed to make sure our losses were limited).
So, with that in mind, and having taken a look at overnight action, we are expecting more of the same today. Specifically, we’re going to set up with a range that gives us the chance to get in both on a breakout trade and an intrarange trade, and will use this range throughout the midday and afternoon European sessions.
As ever, take a quick look at the chart below to get an idea of what happened recently, and where we are looking to get in and out of the markets today.
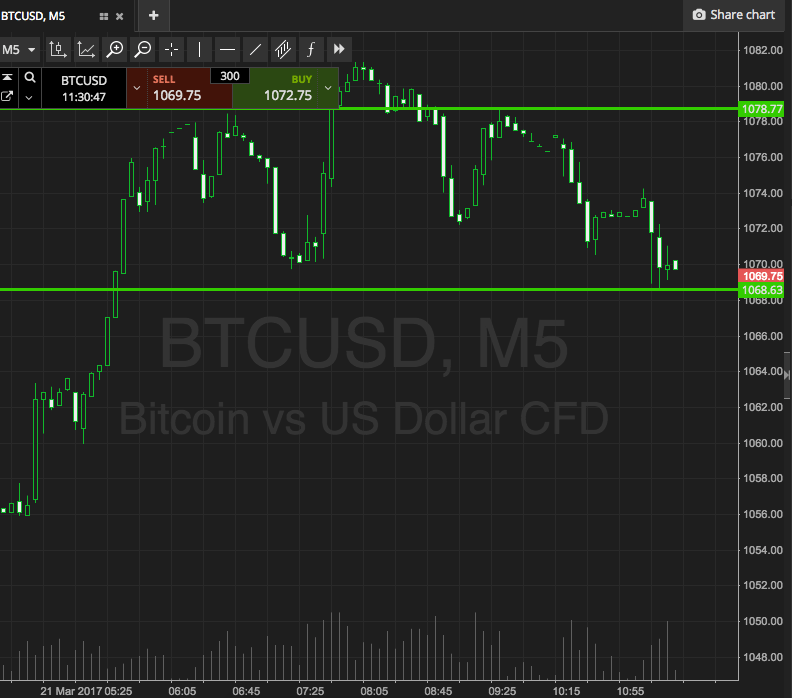

As the chart shows, the range we are focusing on today is defined by support to the downside at 1068, and resistance to the upside at 1078.
If we see price breakthrough support, we will look for a close below that level to signal a short entry towards 1058. A stop loss on the trade at 1071 defines risk.
Conversely, a break above support will signal a long entry (assuming we get the candle close above the level) and we will get in long towards 1088.
Let’s see what happens.
Charts courtesy of SimpleFX.