So here we are at the end of another week and it’s time to try and put some levels together with which we can approach the bitcoin price in the European market this morning. Action has been pretty volatile this week and we fully expect this volatility to continue as the session matures towards the weekly close throughout today’s session.
With any luck, we’ll be able to take advantage of any volatility as and when it materializes. We are going to approach the markets today with a relatively tight range, given that action overnight hasn’t really given us too much by way of solid levels to go at. If we can limit our exposure to relatively tight stop losses (as we are forced to do, given we are using a tight range) than we aren’t exposing ourselves to too much risk on any of the trade-oriented.
So, with this noted, let’s get some levels together with which we can approach the markets today.
As ever, take a quick look at the chart below before we get started so as to get an idea of what is on and why things stand right now. The chart highlights our key levels and also illustrates the action we saw overnight and that brought us to this point.
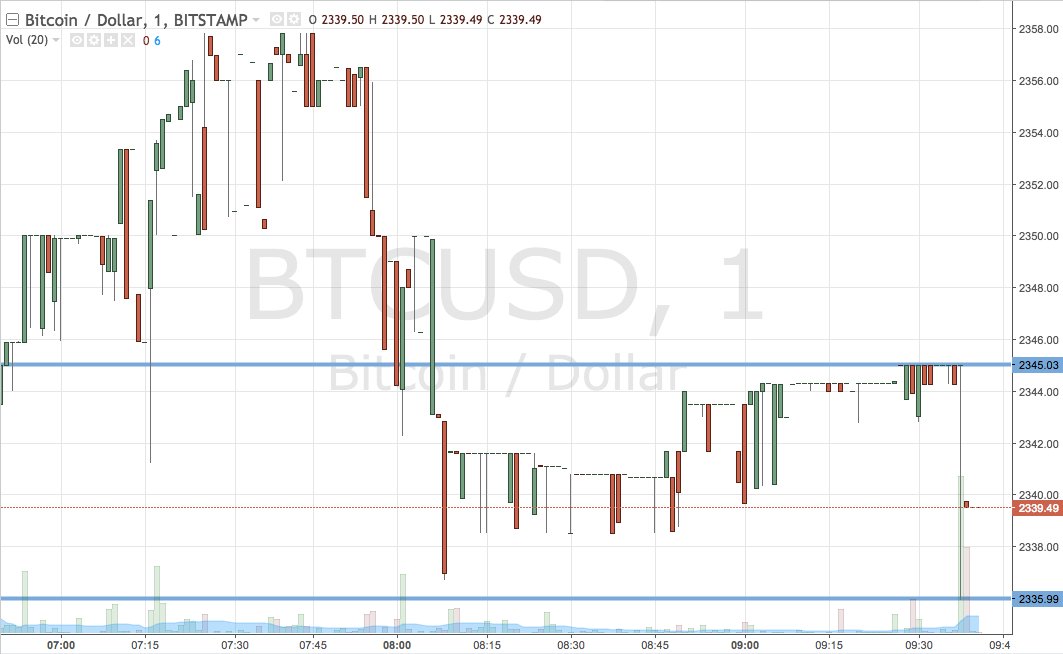

As the chart shows, then, the range we have outlined for today is defined by support to the downside at 2335 and resistance to the upside at 2345.
We are going to look at the upside trade first, so if we see a break above resistance, we will enter long on a close above this level with an immediate upside target of 2360. A stop loss on the trade at 2340 will ensure we are taking out in the event of a bias reversal.
Looking the other way, a close below support will have was in short towards a downside target of 2320. A stop loss on this one act 2340 looks good.
Charts courtesy of Trading View