So that’s another day done in our bitcoin price trading efforts and it’s been a pretty good one so far. Things have been relatively active (which we like) and we’ve had a couple of breakouts serve up opportunities to jump in and out of the markets for quick turnaround profits.
We’re about to close out the day in Europe, but the afternoon in the US is only just getting going. We often see a continuation of the European action throughout the US session, so there’s a good chance we’ll get a couple more opportunities to get in and out of the markets according to the rules of our intraday strategy before things close out for the night.
So, with this in mind, here’s a look at what we’re going for and where we in to go for it.
As ever, take a quick look at the chart below before we get started so as to get an idea of where things stand and what happened during the session today to get us to this point. It’ s a one-minute candlestick chart and it’s got our key range overlaid in blue.
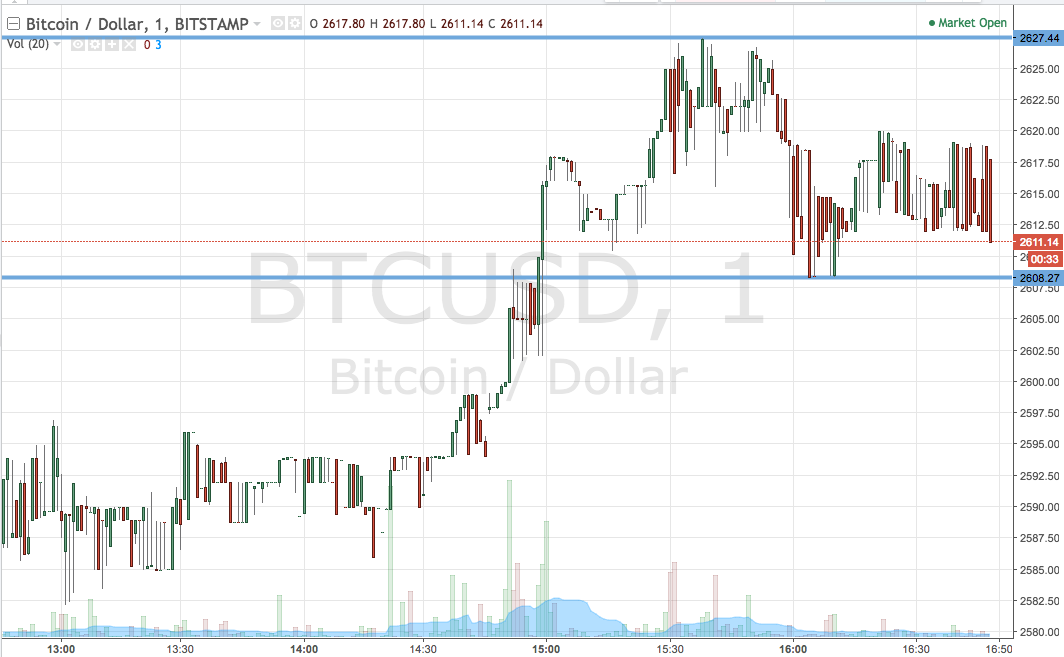

As the chart shows, then, the range we are looking at for the session is defined by support to the downside at 2608 and resistance to the upside at 2627. We’re going to stick with just our breakout strategy on this one and shelf our intrarange approach for the time being.
So, if we see price break above resistance, we’ll be looking at getting into a long trade on a close above that level towards an immediate upside target of 2650. Conversely, a close below support will have us in short towards a downside target of 2585. Stops on both positions just the other side of the entries will make sure we don’t get caught on the wrong end of a loss.
Let’s see what happens.
Charts courtesy of Trading View