After a busy week or so from a fundamental perspective, the bitcoin price looks to have settled down a little bit. Settled, that is, into a range bound, sideways trading phase. We have seen a few small breakouts, and a couple of times we have been able to jump in and out of the markets on said breakouts, but other than that, price has held pretty flat. Exactly where things will go from here is not entirely clear. Price hasn’t really given us any indication of what the overarching trend is right now (although we’re still pretty certain that the 1100 level that we have been touting as long term support will remain in place for the foreseeable future) and we’re relying pretty heavily on price action alone for both the risk and the reward sides of our market operations.
Nothing really new there, but it just makes things a little less simple to judge.
Anyway, we’re rambling a bit here. Let’s skip forward to some key levels and get things outlined for the session. Take a look at the chart below to get an idea of where things stand, and where we are looking to get in and out of the markets according to the rules of our intraday strategy as and when price moves today.
It’s a five-minute candlestick chart, and it’s got our key range overlaid in green.
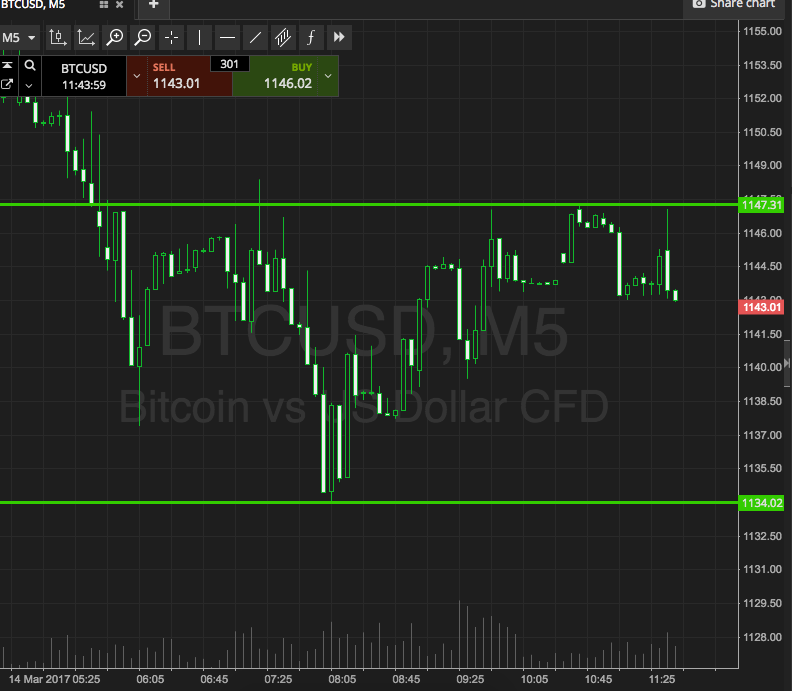

As the chart shows, the range in focus for the session today comes in at support to the downside at 1134, and resistance to the upside at 1147. A break above resistance will get us in long towards an immediate upside target of 1160. Conversely, a close below support will get us in short towards 1125. Stops just the other side of the entries on both positions will ensure we are taken out of the trade in the event of a bias reversal.
Charts courtesy of SimpleFX