Things are really starting to move now in the bitcoin price. Yesterday, and to some extent, the day before, action was relatively flat. This is not necessarily a bad thing. Sometimes, and especially after a period of extended movement, we need to see some flat action as price consolidates. Consolidation generally precedes a return to volatility, and that’s exactly what we’re seeing now. Price overnight moved – not substantially in one direction, but up and down – considerably, and we were given a number of opportunities to get in and out the markets according to the rules of our intraday strategy. Hopefully, during today’s European morning session, we will see more of the same. So, with this in mind, and ahead of the European session kicking off, let’s take a look at what we’re focusing on in the bitcoin price this morning, and see if we can outline some levels with which we can draw profit from the market. As ever, take a look at the chart below to get an idea of what’s on. It is a five-minute candlestick chart, and it has today’s range overlaid in green.
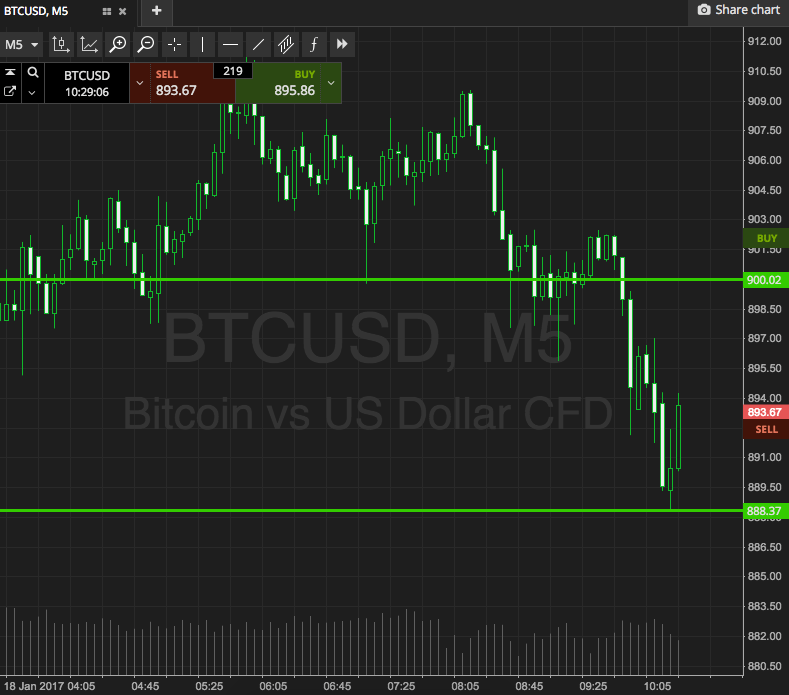

As the chart shows, the range we are looking at is defined by support to the downside at 888, and resistance to the upside at 900. Breakout only this morning, given that we’re likely to see some pretty choppy action.
If price breaks through resistance, we’re going to look to get in long towards an immediate upside target of 910. A stop loss on the trade at 897 will ensure we are taken out of the position in the event of a bias reversal. Looking short, if price breaks below support, we will enter towards a downside target of 880. Again we need a stop loss on this one, and somewhere in the region of 890 looks good.
Let’s see how things play out.
Charts courtesy of SimpleFX