Some days we’ve got to take what the market gives us. This has been one of those days. We’re closing in on the end of the European session, and the bitcoin price has done nothing of note, with a break to the downside the exception to the day’s general play. We managed to get in on the break (as it signalled based on a close below the support level we highlighted earlier as being one to watch) and we got out for a small profit on a take profit hit, but other than that, we’ve been flat on the day.
Not to worry, of course – we’ve got a fresh evening to go at things ahead of us, and there’s plenty of time and room for some volatility as we push forward.
So, with this noted, let’s get to it.
Take a look at the chart below in order to get an idea where things stand before we get going. It’s a five-minute candlestick chart and it’s got our focus range overlaid in green.
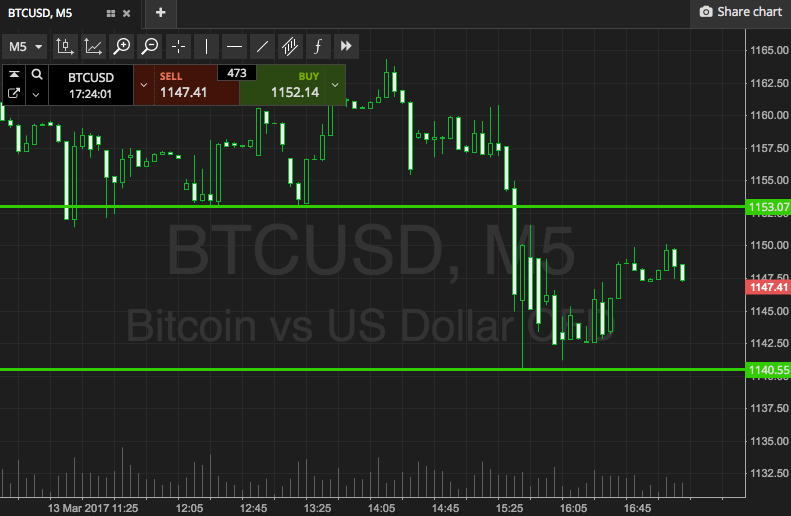

As the chart shows, the range we are going at this evening is defined by support to the downside at 1140, and resistance to the upside at 1153. The chart also highlights the just mentioned downside action, and where price took us on the trade we got into earlier.
So if we see price break below support, we are going to look at getting in short towards an immediate downside target of 1130. A stop on the trade at 1143 will ensure we get taken out of the position in the event that price reverses to trade against us.
Looking the other way, if we see a close above resistance, we’ll look to get in long towards an upside target of 1163. A stop on this one at 1150 looks good.
Charts courtesy of SimpleFX