In this morning’s analysis, we highlighted the fact that action in the bitcoin price over the last week had brought the currency to trade at fresh highs, and that these highs made it difficult to predict what would likely come next (on the shorter-term charts, that is). With price approaching a retest of said highs, we noted that one of two things will happen – one, we see a break of the highs and a continuation of the longer-term upside run, or two, we see a relatively steep correction and have to shift our downside risk parameters accordingly. As it turns out, the latter of these two scenarios looks to have played out. Again, this is only on the short term charts, so chances are the longer-term bias remains with the upside. Time will tell, of course.
Anyway, let’s get some levels outlined for this evening session, and try to put together a strategy with which we can profit from any volatility that we see in the market near term.
As ever, take a quick look at the chart below before we get started to get an idea of what we’re looking at from a key level perspective, and what happened during today’s session. It is a five-minute candlestick chart, and it has our key range overlaid.
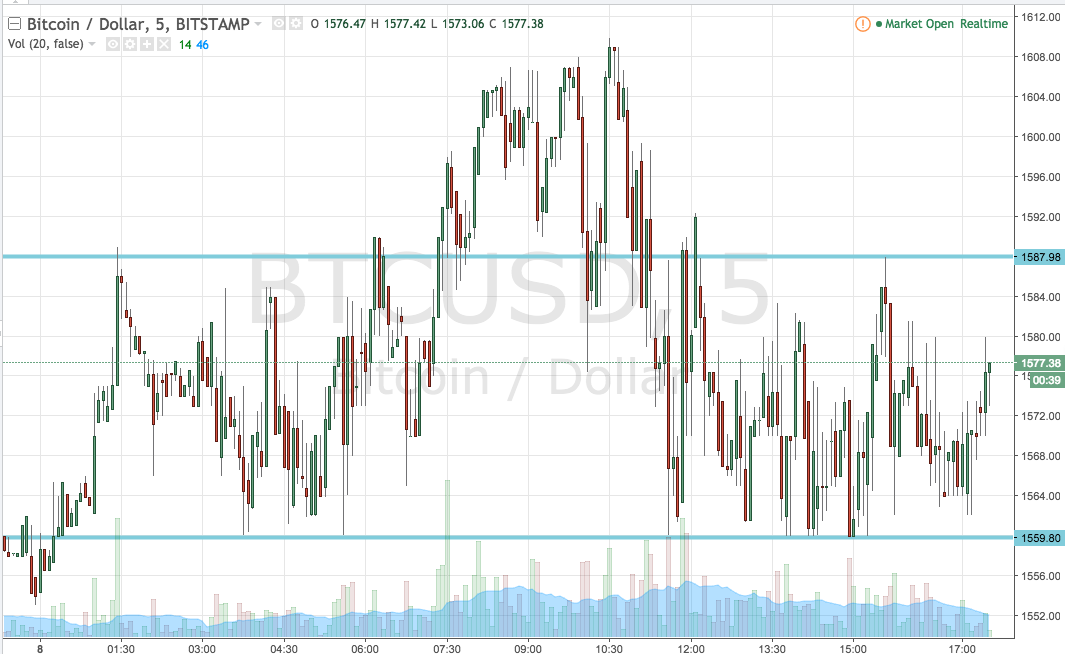

As the chart shows, the range we are looking at for this evening’s session is defined by support to the downside out 1559 and resistance to the upside at 1587. That’s quite a wide range, and intrarange is an option for the more aggressive player, but we are going to look at breakout only for the time being. Specifically, if we see price break above resistance, we will enter long towards an upside target of 1600. Conversely, a close below support will get us in short towards 1545. A stop loss on both trades just the other side of the entry (around three or four dollars away from fill price) will ensure we are taken out the trade in the event of a bias reversal.
Charts courtesy of Trading View