Ok, let’s get to it. Here goes another day of trading in the bitcoin price, and with any luck, we’ll see a continuation of the current market’s underlying trend – that is, and upside run. We first saw the signs of price bottoming out during the early session out of Europe yesterday, and then things settled down post run around midday. Our expectations were that – given the sideways action saw, and the consolidation that this sideways action inferred – we would see a breakout one way or the other early evening. We get exactly that breakout, and it turned out to be a bullish one. That’s a nice change from the downside action we’ve seen over the last week or so, and it suggests that there is some real fundamental strength in and around the 1000 flat level right now. Sure, we said this about the 1100 level and it didn’t turn out to be as correct as we might have liked, but there you go. We aren’t perfect.
Anyway, let’s get to the session today, and see what we can carve out of the market as and when price starts to move. As ever, take a quick look at the chart below to get an idea of what’s on and where things stand in the bitcoin price market right now. It’s a five-minute candlestick chart as usual, and it’s got our key range overlaid in green.
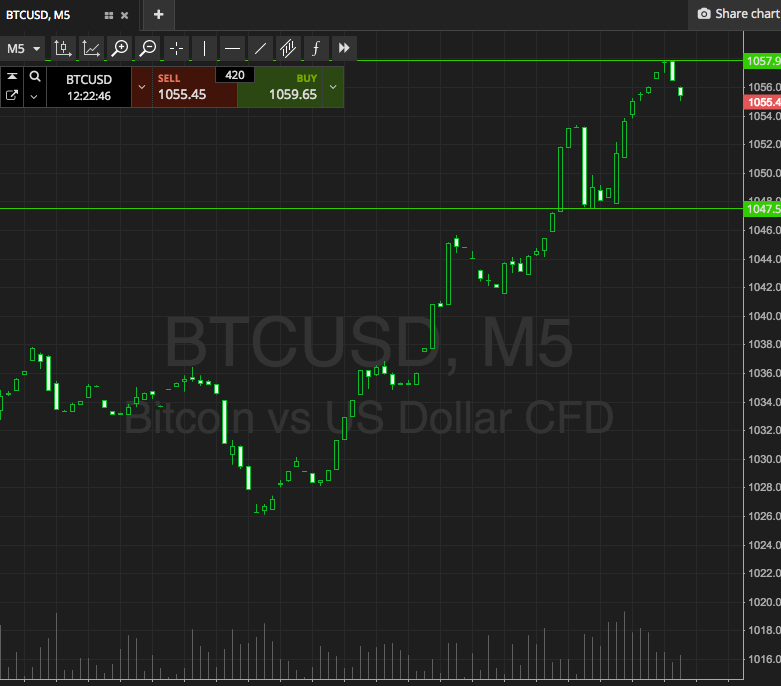

As the chart shows, our range for today is defined by support to the downside at 1047 and resistance to the upside at 1057. Breakout only with this one, at least for now. So, long on a close above support towards an immediate upside target of 1067, and short on a close below resistance towards a downside target of 1037.
Pretty simple.
Let’s see what happens.
Charts courtesy of SimpleFX