Late yesterday afternoon, shortly after the markets closed in Europe, we published our twice-daily bitcoin price analysis piece, with a focus on the levels that we would be keeping an eye on throughout the US afternoon session and beyond, and highlighting how we would respond to price reaching these levels. We suggested that – with the recent range action we had seen being tightly contained, we could be due for a sharp break out in either direction in the event that the bitcoin price penetrated either in term support or resistance. As it turns out, we got this breakout early on Friday morning, and we’re now looking afresh set of key levels as we head into the weekend. With this said, what are we watching, and how can we interpret price action once it reaches the levels we are keeping an eye on? Take a quick look at the chart.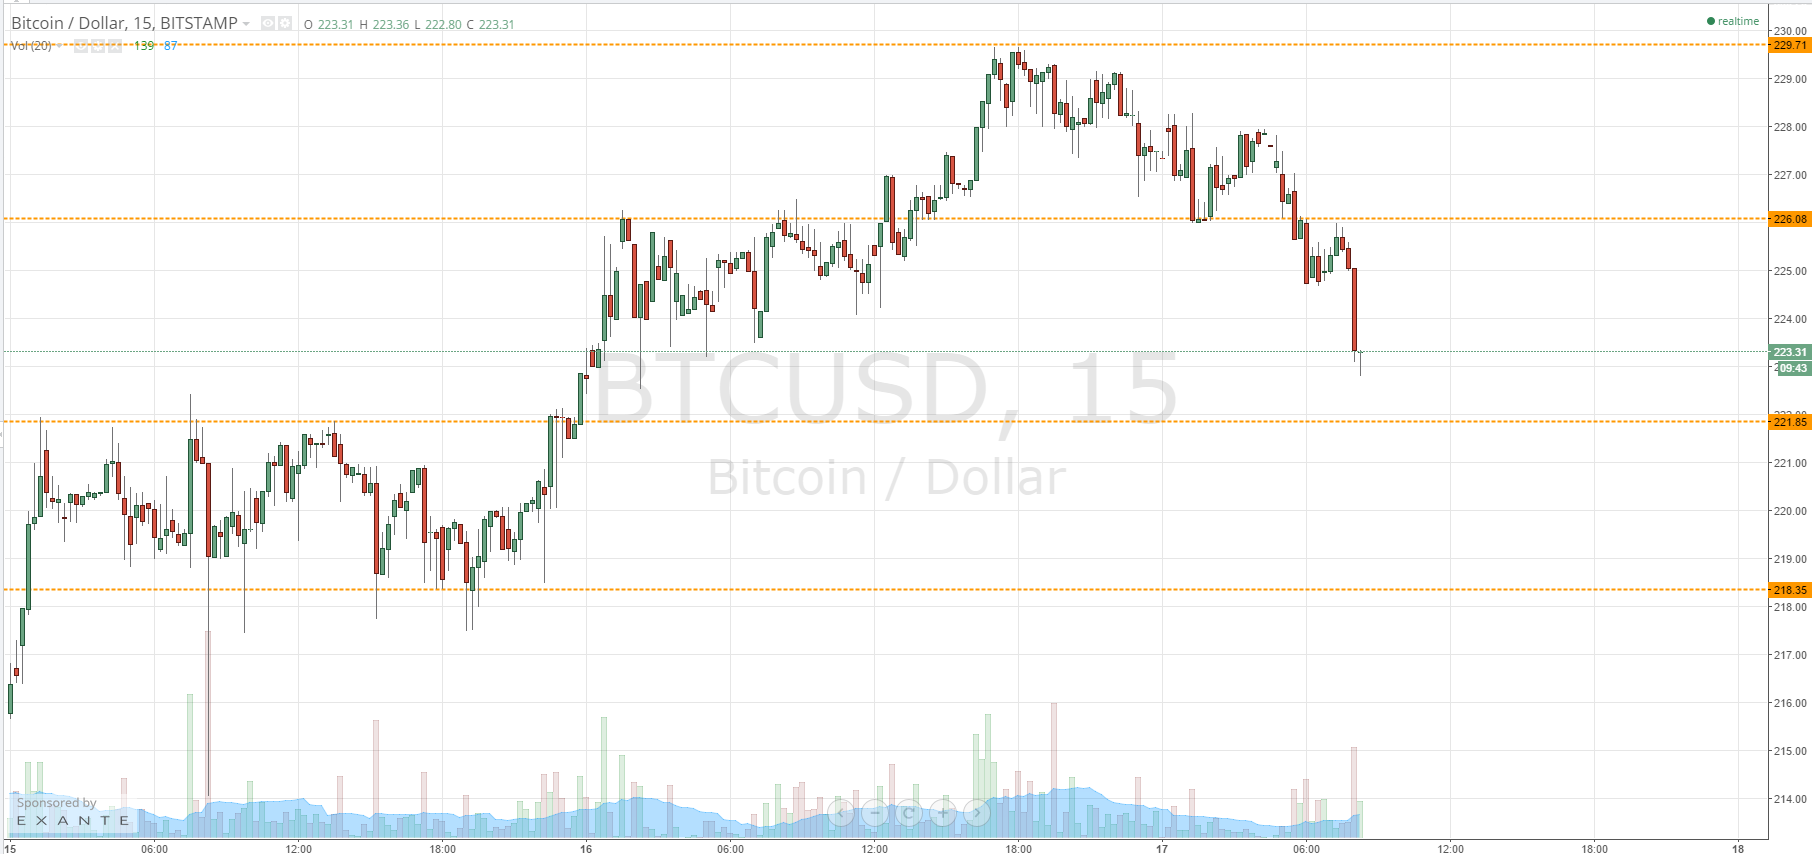
As the chart shows, having broken 226.08 to the downside, we – a small retest aside – declined straight towards what now serves as in term support at 221.85. This, alongside the aforementioned 226.08 (which now serves as in term resistance) are the levels to keep an eye on this morning. We are trading just ahead of in term support at the moment, so we will look for a bounce to offer up a medium-term bullish bias, with initial target of 226.08, and a stop loss just shy of 221 flat. Conversely, if we get a break below in term support, we will look to the downside and enter towards 218.35. In this trade, a stop loss somewhere around 223 flat would ensure we are taken out of the trade in the event of a bias reversal.
Looking the other way, if we do get a run up to 226.08, a break above this level would validate 229.71 medium-term, with a stop loss just below 225 ensuring a nice risk reward profile.
Charts courtesy of Trading View