

Bitcoin Price Key Highlights
- The Bitcoin price continued to rocket higher and our bullish bias paid off in the near term.
- There are many positive signs emerging for the price and the idea of buying dips is still a good option.
Bitcoin price traded above the $300 level and it looks like it might test the $350 area if buyers stay in control.
Buyers to take the price higher?
The Bitcoin price surged higher this past week, as the 4-hours chart clearly speaks a lot about how buyers were in control. The price broke a monster resistance area of $300 and the price even closed the week above the mentioned area. A new weekly high was formed around $335 where there is a minor resistance noted. There is a bullish trend line formed on the 4-hours chart, which might act as a support if the price moves lower from the current levels.
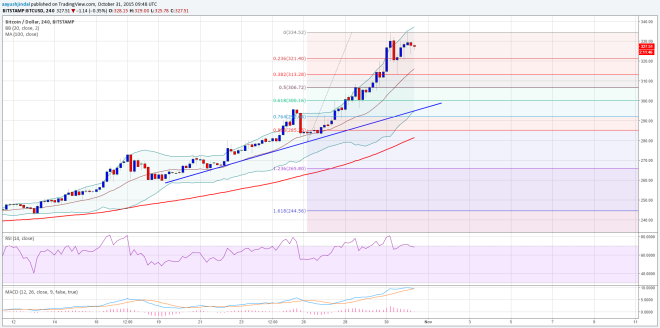

The price already corrected once towards the downside and tested the 38.2% Fib retracement level of the last leg from the $280 low to $334 high. The Middle Bollinger Band was also aligned around the stated area and prevented the downside. If the price has already completed a correction once, then there is chance that it may break the last swing high and head towards the next resistance area of $350. If buyers manage to take the price further higher, then you never know the price might even challenge the $400 barrier in the near term.
On the downside, the 38.2% Fib level is a pivot area, followed by the 50% Fib level and the trend line support area.
Intraday Support Level – $310
Intraday Resistance Level – $335
The 4H RSI and MACD are in the bullish zone, which means there can be another move higher.
Charts courtesy of Trading View