Key Highlights
- Bitcoin price continued to rocket higher in the tensed market, as there were a lot of inflows noted during this past week.
- There are many supports on the downside that are likely to act as a hurdle for sellers if the price moves lower from the current levels.
Bitcoin price traded close to 300.00, and traded as high as 294.63 where it found sellers and moved a bit lower.
We stated in the previous weekly analysis that Bitcoin price remains in an uptrend, and there is a high probability that price might continue to move higher. The price did move higher, as buyers remained in control. We need to see whether the price corrects lower from the current levels or not, and how much it corrects in the mentioned situation.
Looking to buy?
The price after a minor correction moved higher and spiked more than 20 points to trade near a major barrier of 300.00. There was a solid buying interest, which helped buyers to gain strength and take the price higher. After the price traded as high as 294.63, there was a minor pullback, which found support around the 23.6% Fib retracement level of the last leg from the 252.00 low to 294.63 high. However, it looks like the correction phase might continue to for some time, as there is a divergence forming on the RSI. If sellers manage to take the price below 23.6% Fib level, then a test of the 38.2% Fib level is possible.
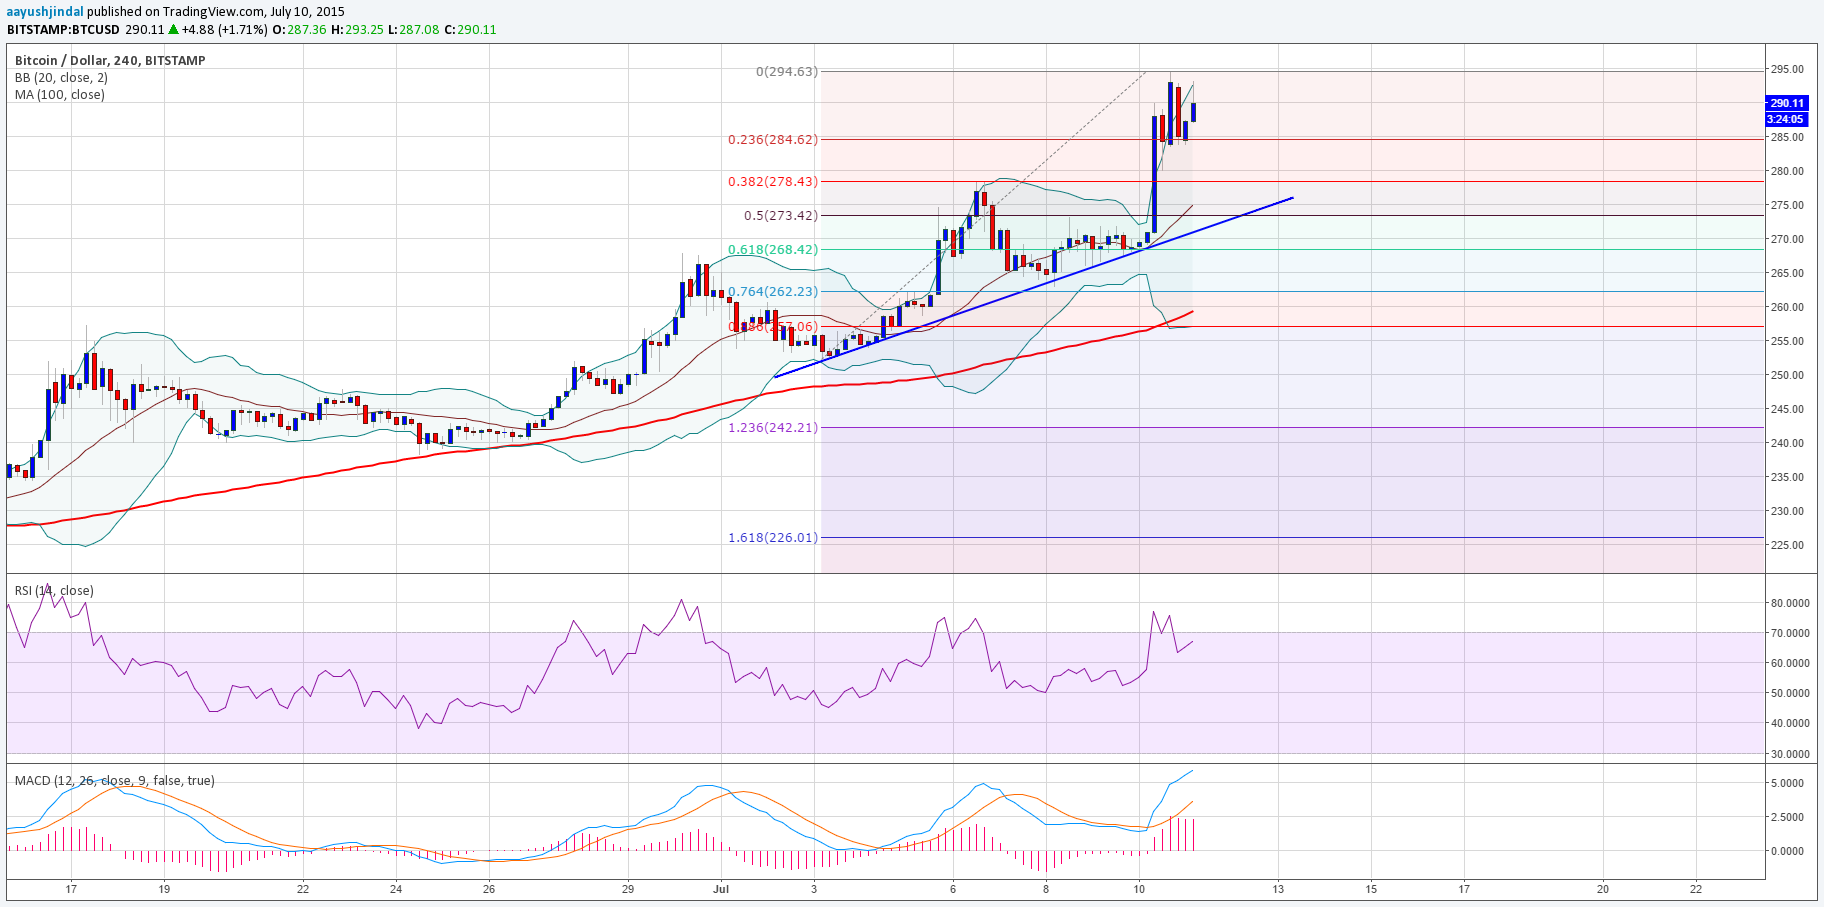
There is a monster support trend line formed on the 4-hours chart, which could act as a hurdle for sellers if the correction phase is ignited.
Intraday Support Level – 275.00
Intraday Resistance Level – 300.00
We would like to stick with our bullish view in the near term.
Charts courtesy of Trading View